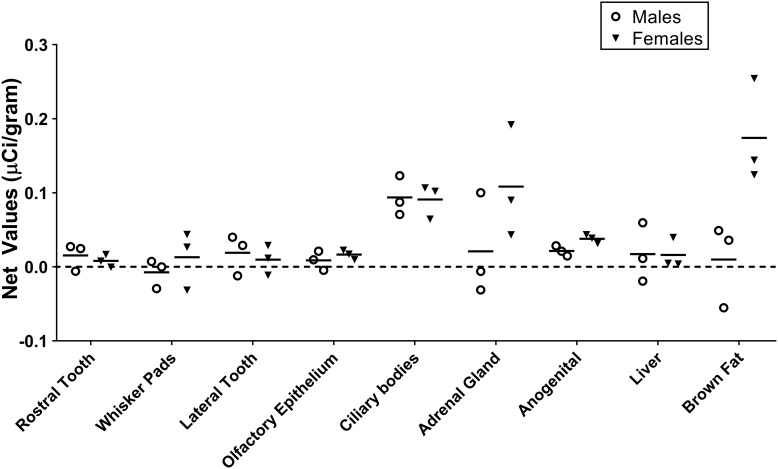
FIGURE 1.
Quantification of receptor autoradiography for net μCi/gram OXTR in the peripheral tissue of neonatal Microtus ochrogaster. The net OXTR binding values (net = density of 0–1000 nM) for all regions in prairie voles with specific OXTR ligand binding are compared against a common y-axis. Group means and individual subject data are plotted males (open circles), females (filled triangles).

