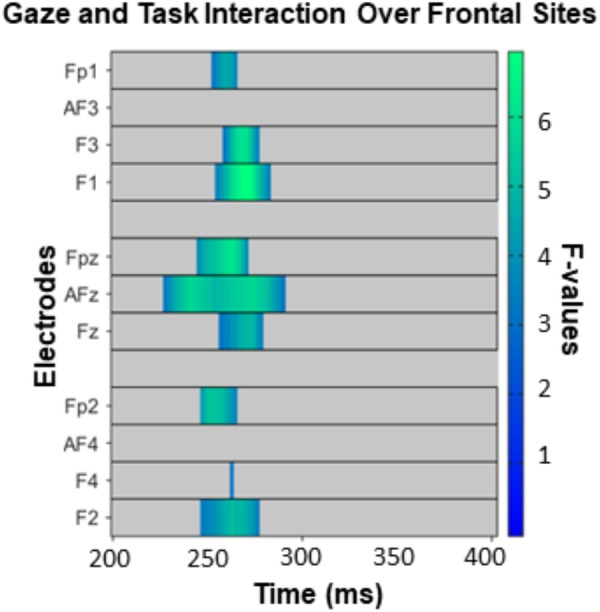
FIGURE 4.

The interaction between task and gaze over frontal sites between 200 and 400 ms, corrected for multiple comparisons with the Permutation Based Cluster Mass technique at p < 0.05. Each electrode included in the analysis is plotted on the y-axis, while the x-axis represents time (post face onset). Colored “blocks” represent significant F-values, with the magnitude of the F-value plotted according to the right-hand color bar.
