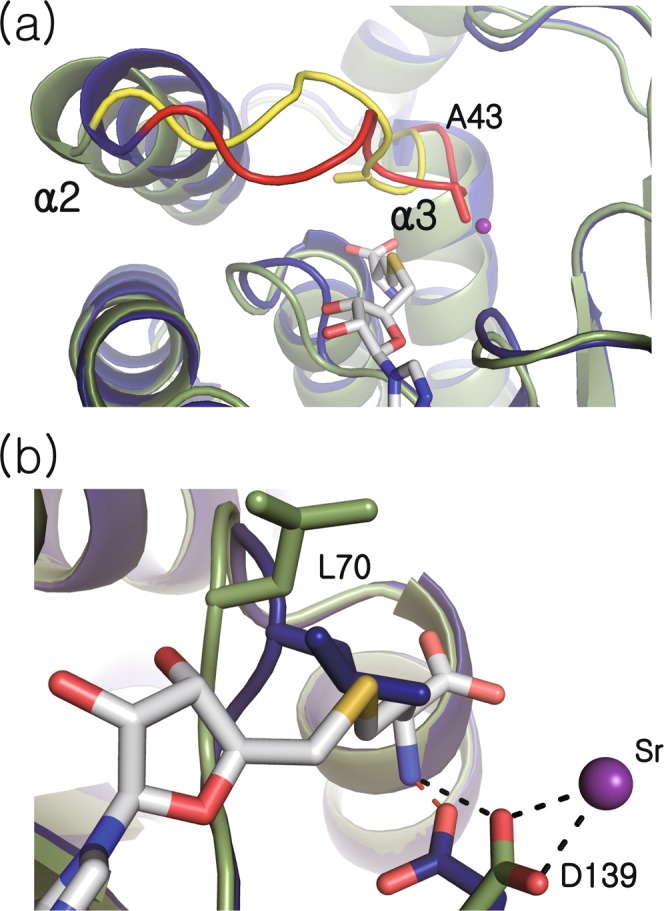
Figure 4.

Comparison of ligand-free and cofactor-bound structures. (a) Ribbon representations of ligand-free and cofactor-bound forms are shown in blue and green, respectively. In the cofactor-bound structure, SAH and strontium ions are presented at white-gray sticks and a purple sphere, respectively. The loops connecting α2 and α3, which undergo the largest conformational change between ligand-free and cofactor-bound structures are highlighted in red and yellow, respectively. (b) Close-up view of superimposed ligand binding sites of ligand-free and cofactor-bound structures.
