
Figure 8.
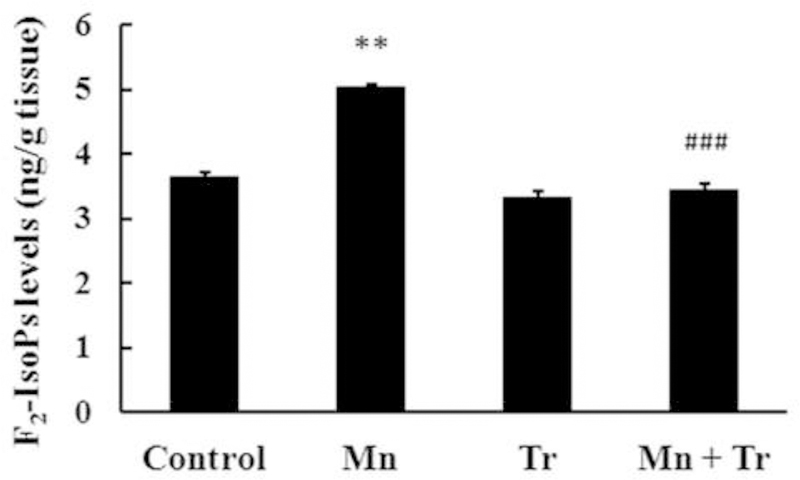
F2-IsoPs production in striata from immature rats exposed in vivo to Mn and/or Trolox™ for twenty days (PN8-PN27). The panel shows F2-IsoPs production from rats treated with saline (control; NaCl 0.9%), MnCl2 20 mg/kg (Mn), Trolox™ 1 mg/kg (Tr) or MnCl2 20 mg/kg plus Trolox™ 1 mg/kg (Mn + Tr) for twenty days (PN8–27). The structures were analyzed on PN29. Results represent mean ± S.E.M and are expressed as ng F2-IsoPs/g tissue. Statistical analysis was performed by ANOVA followed by Duncan’s test. n = 4; ** p < 0.01 compared to control; ### p < 0.001 compared to 20 mg Mn/kg group.