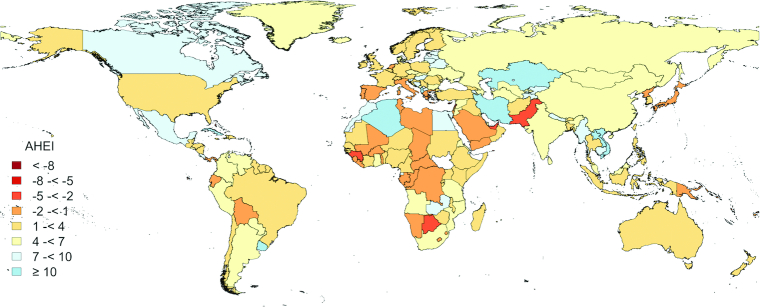
Figure 2.
Geographic distribution of changes in AHEI scores from 1990 through 2017 in men and women ≥25 y in 190 countries/territories. White areas indicate that dietary data were not available. The AHEI scores range from 0 (nonadherence) to 100 (perfect adherence). AHEI, Alternate Healthy Eating Index.

