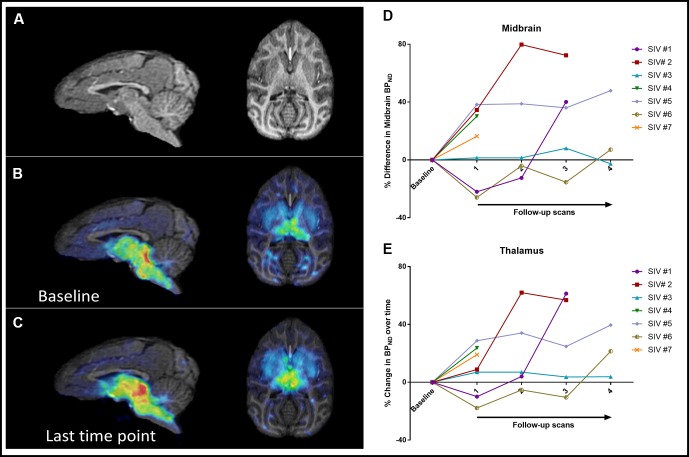
Figure 1.
Sagittal and axial brain MRI images (A) as well as parametric maps of 11C-DASB BPND at baseline (B) and last time point (C) of SIV #4. Increased BPND can be detected visually at the last time point compared to baseline. Changes in BPND over the course of disease in all seven animals in the midbrain (D) and thalamus (E).

