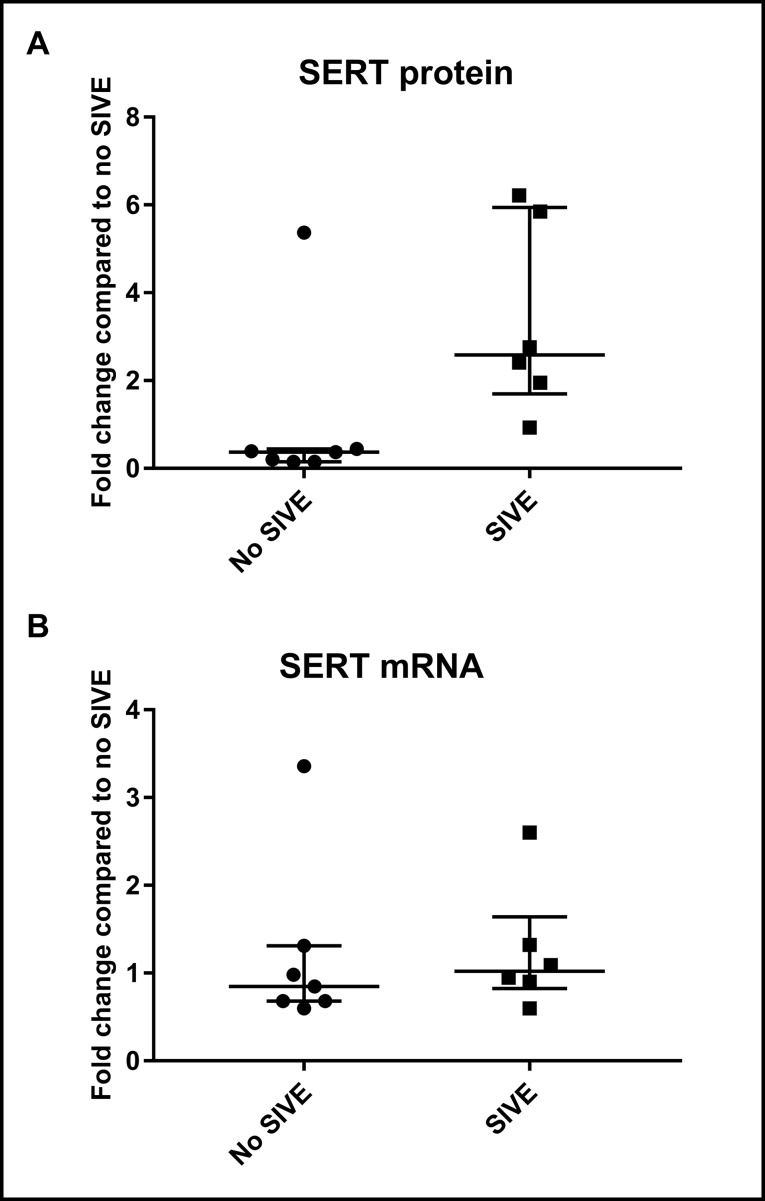
Figure 4.
Western blotting and qPCR results in group B animals (whole-brain lysates). (A) Fold change in protein levels of SIVE compared to non-SIVE animals. (B) Fold change in mRNA expression of SIVE compared to non-SIVE animals. Median and interquartile range values are shown (* = p < 0.05; n.s. = non-significant).

