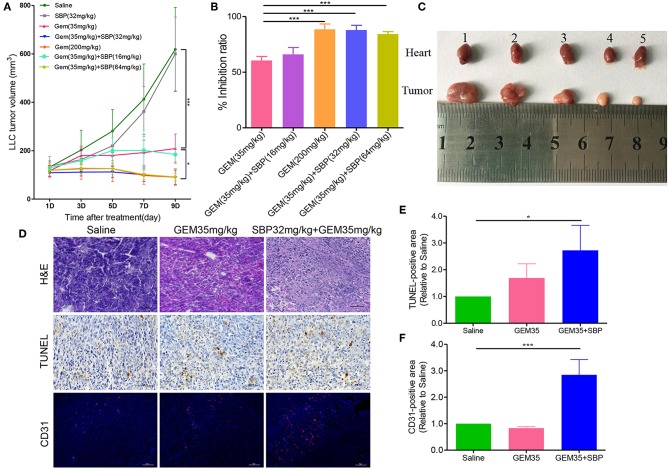
Figure 1.
Effect of SBP combined with GEM on tumor growth and angiogenesis in Lewis lung carcinoma (LLC) tumor models. (A) Tumor volume curves of different treatment groups (n = 6–12 for each group). (B) Quantitative analysis of the tumor inhibition rate (n = 6–12 for each group). (C) The images of tumor tissues at treatment termination. (1) Saline; (2) SBP (32 mg/kg); (3) GEM (35 mg/kg); (4) GEM (200 mg/kg); (5) GEM (35 mg/kg)/SBP (32 mg/kg). (D) Representative images of H&E, TUNEL, and CD31-stained tumor sections. (Scale bar: 50 μm). (E,F) The quantitative analysis of TUNEL+ area and CD31+ area compared to the saline group. *p < 0.05, and ***p < 0.001.

