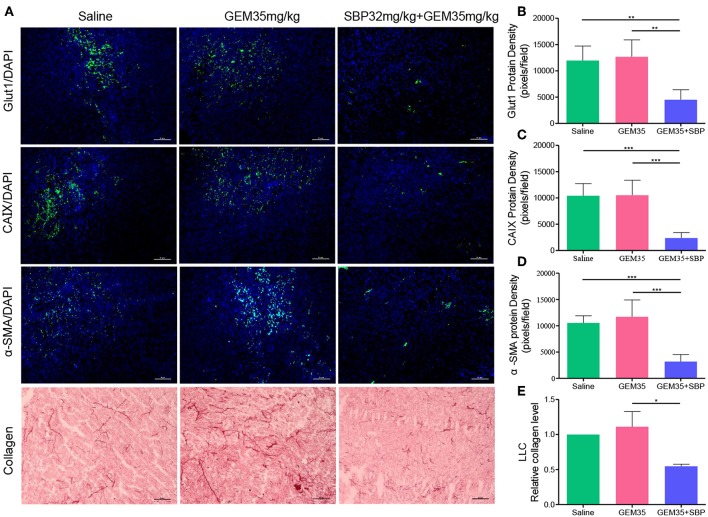
Figure 4.
The effect of combination therapy with SBP and GEM on the tumor microenvironment in LLC tumor model. (A) Representative micrographs of Glut1+, CAIX+, α-SMA+, and collagen+ signals of Saline, GEM 35 mg/kg, and SBP 32 mg/kg/GEM 35 mg/kg treated mice. (Scale bar: 50 μm). (B–E) Quantification of Glut1+, CAIX+, α-SMA+, and cleaved collagen+ signals of Saline, GEM 35 mg/kg and SBP 32 mg/kg/GEM 35 mg/kg treated mice (n = 5 for each group). *p < 0.05; **p < 0.01; ***p < 0.001.

