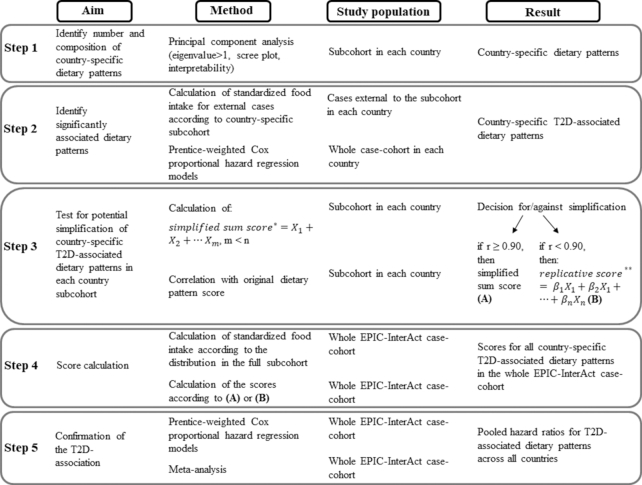
FIGURE 1.
Scheme of the statistical steps to investigate the association between dietary patterns and type 2 diabetes risk. Subcohort in each country = randomly drawn subcohort in each country including noncases and cases of type 2 diabetes; whole case-cohort in each country = randomly drawn subcohort in each country and type 2 diabetes cases external to the subcohort; whole EPIC-InterAct case-cohort = sum of all randomly drawn subcohorts (n = 14,694) and external type 2 diabetes cases (n = 11,183), with an overlap of n = 719 verified incident type 2 diabetes cases in the subcohort, across all included EPIC-InterAct countries. *Sum of a reduced number (m < n) of standardized, unweighted food groups characterized by high factor loadings in the original dietary pattern score. **Sum of all 36 standardized food groups (Xn) multiplied by standardized scoring coefficients (βn). EPIC, European Prospective Investigation into Cancer and Nutrition.

