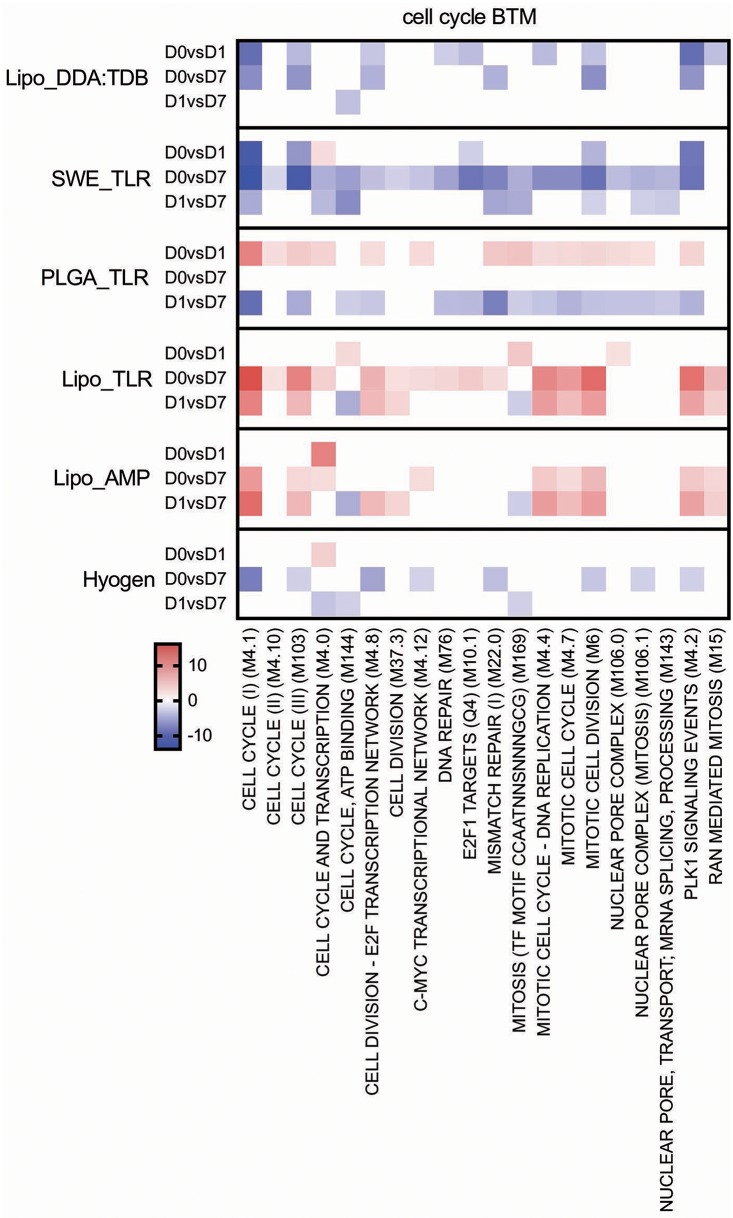
Figure 7.
Cell cycle BTM induced by vaccines. The heat maps show the vaccine-dependent induction of BTM activity determined for D0 to D1 (D0 vs. D1), for D0 to D7 (D0 vs. D7), and for D1 to D7 (D1 vs. D7) changes in the modules. The values shown were calculated by −log(P-value)*1 for positively enriched BTM and as −log(P-value)* −1 for negatively enriched BTM. A cut-off of an FDR of q < 0.1 was employed. Red colors indicate BTM upregulation and blue downregulation. BTM, blood transcriptional modules.

