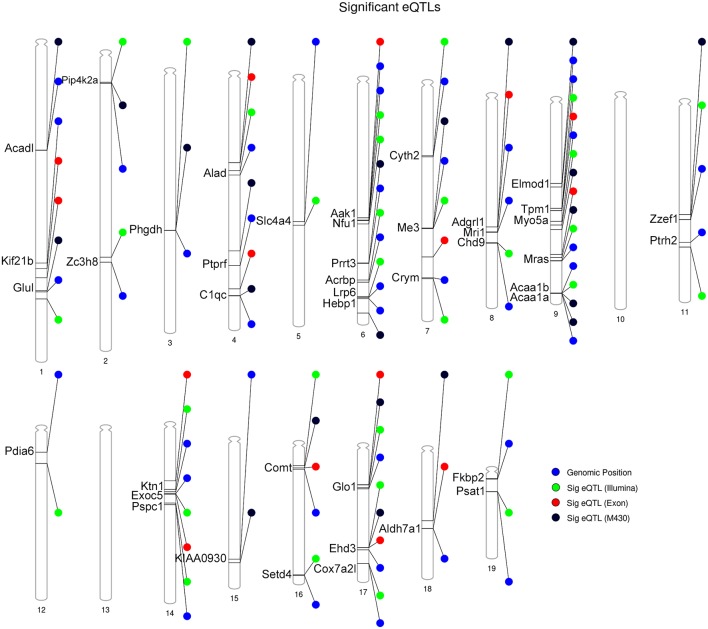
Figure 4.
Summary of DE proteins whose transcripts demonstrate significant local modulation by a cis eQTL in the BXD family. Gene position for DE proteins indicated by the blue circle. Position of peak markers significantly associated with cognate gene expression is provided for each striatal microarray expression platform. Illumina = Illumina mouse-6 v1.1 expression beadchip array; the M430 = Affymetrix Mouse Genome 430 2.0 array; Exon = Affymetrix Mouse Exon 1.0 ST Array. Genome-wide significance of marker associations based on 1,000 permutations. Thirty genes demonstrate the same strain effect on both transcript and protein levels (e.g., higher expression associated with the B6 allele relative to the D2 allele). Thirteen genes demonstrate mismatched expression: Acrbp, Adgrl1, Chd9, Cox7a2l, Hebp1, Nfu1, Prrt3, Psat1, Pspc1, Ptprf, Slc4a4, Zc3h8, and Zzef1.

