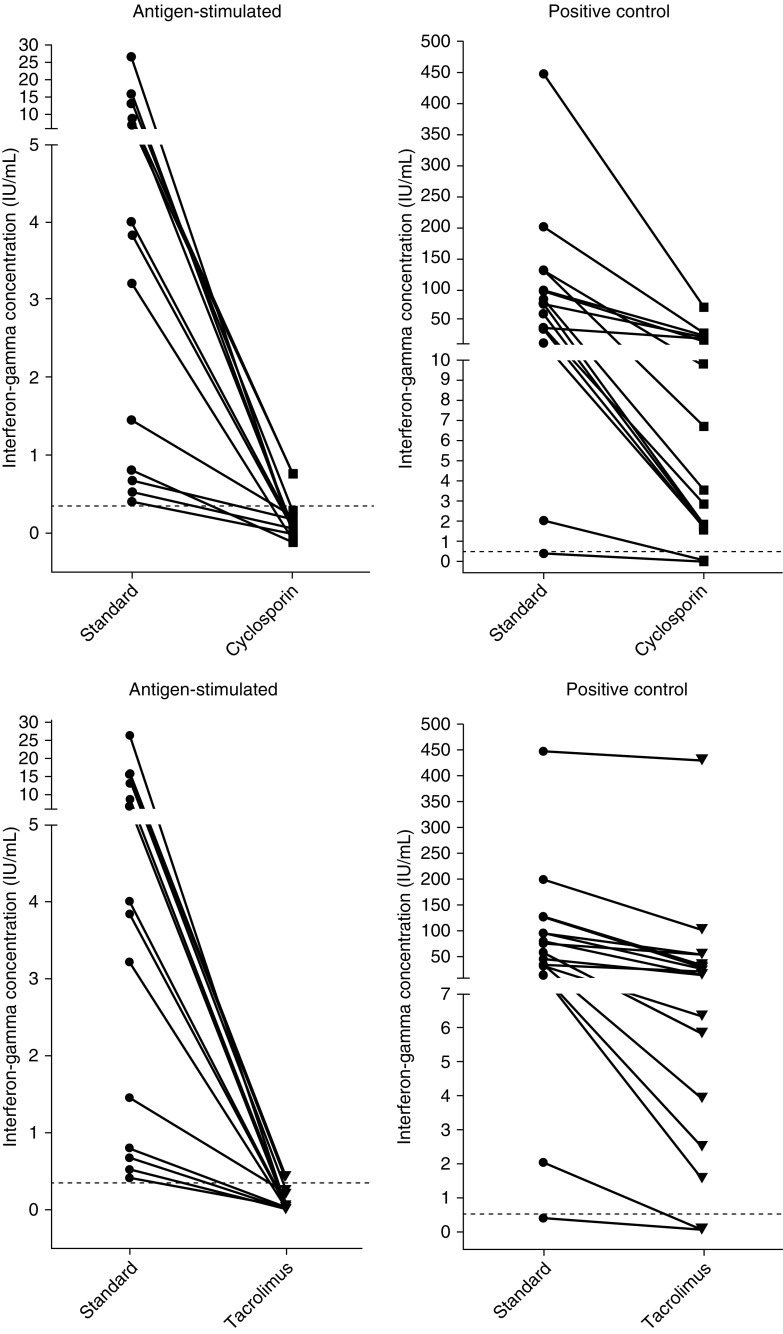
Figure 1.
Background-corrected interferon-γ concentrations in antigen-stimulated (left) and positive control (right) samples in individual participants in the standard assay set compared with sets with added cyclosporin (upper panel; n = 13) and tacrolimus (lower panel; n = 13). Dotted lines indicate the cutoff for a positive test result in antigen-stimulated samples (0.35 IU/ml) and the cutoff for a valid positive control response (0.5 IU/ml).

