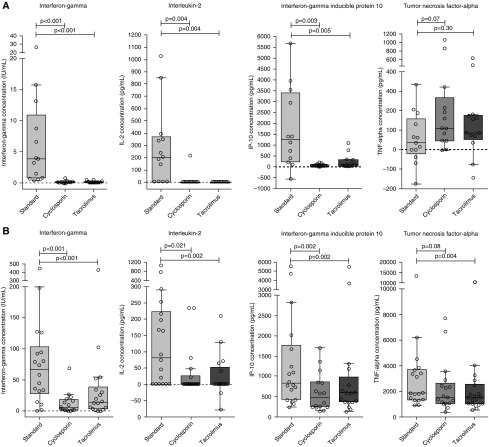
Figure 2.
Background-corrected interferon-γ, interleukin 2 (IL-2), interferon-γ–inducible protein 10 (IP-10), and tumor necrosis factor-α (TNF-α) concentrations in (A) antigen-stimulated (n = 13) and (B) positive control (n = 18) samples in standard assay sets and sets with added cyclosporin and tacrolimus. Box plot with Tukey whiskers; horizontal lines depict the medians; P values were calculated with Wilcoxon matched-pairs signed-rank tests. Negative values are due to background correction (see the Methods section).

