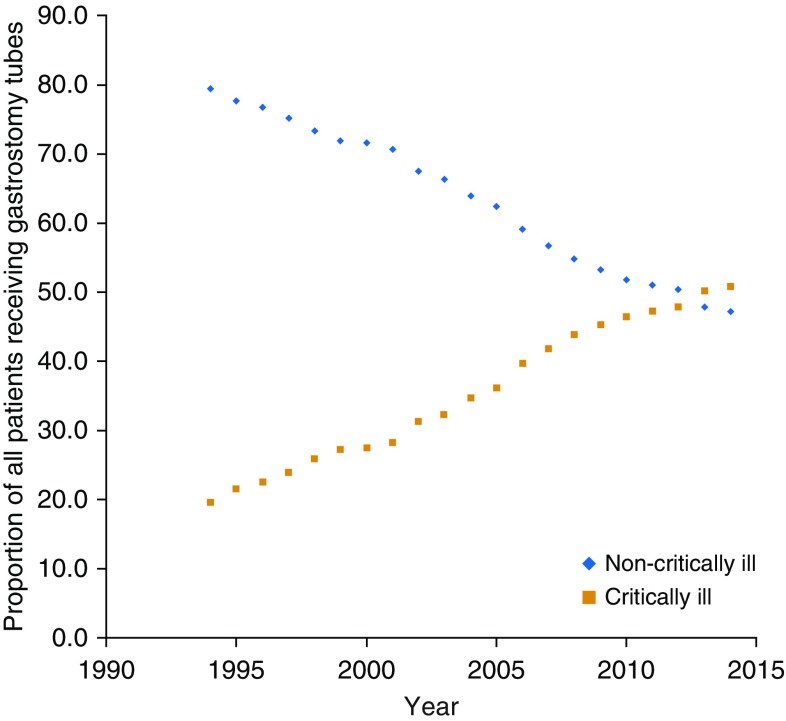
Figure 2.
Proportion of gastrostomy tubes placed in critically ill and noncritically ill hospitalized patients, 1994–2014. Among all recipients of gastrostomy tube, the proportion of gastrostomy tubes placed in critically ill patients (orange squares) has steadily increased and ultimately superseded the proportion of gastrostomy tubes placed in noncritically ill (blue diamonds) over the last 20 years.

