Figure 5.
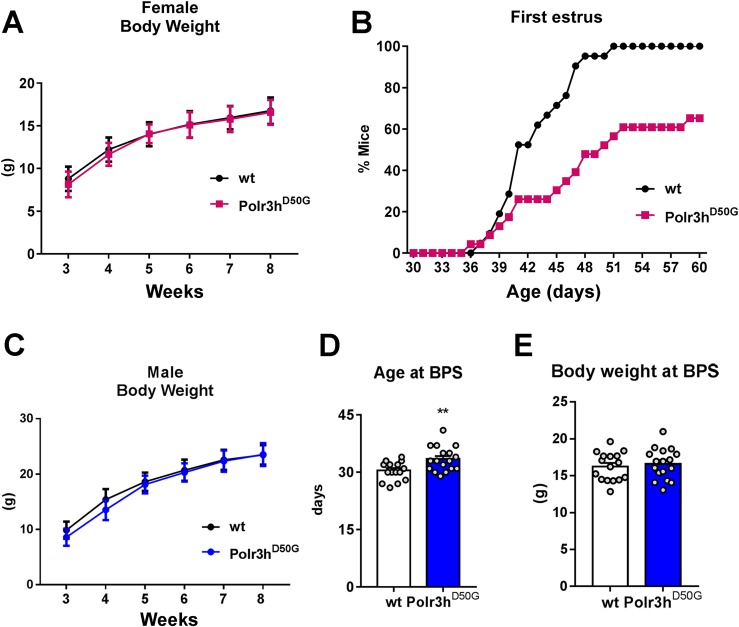
The Polr3hD50G mice have delayed pubertal maturation. (A) Progression of body weight in females in two cohorts (n = 21 wt and n = 23 Polr3hD50G). (B) Survival graph showing age of first estrus in percentage of mice for two cohorts, as in (A). (C) Progression of body weight in males in two cohorts (n = 10 wt and n = 20 Polr3hD50G). (D) Age at BPS. Data were analyzed by two-tailed t test [n as in (F), df 31, t = 2.9; P = 0.005]. F test to compare variances showed no difference, P = 0.3. (E) Bar graph showing body weight at BPS. Data were analyzed by two-tailed t test [n as in (C), df = 31, t = 0.5; P = 0.60]. F test to compare variances showed no difference, P = 0.76. **P < 0.01.

