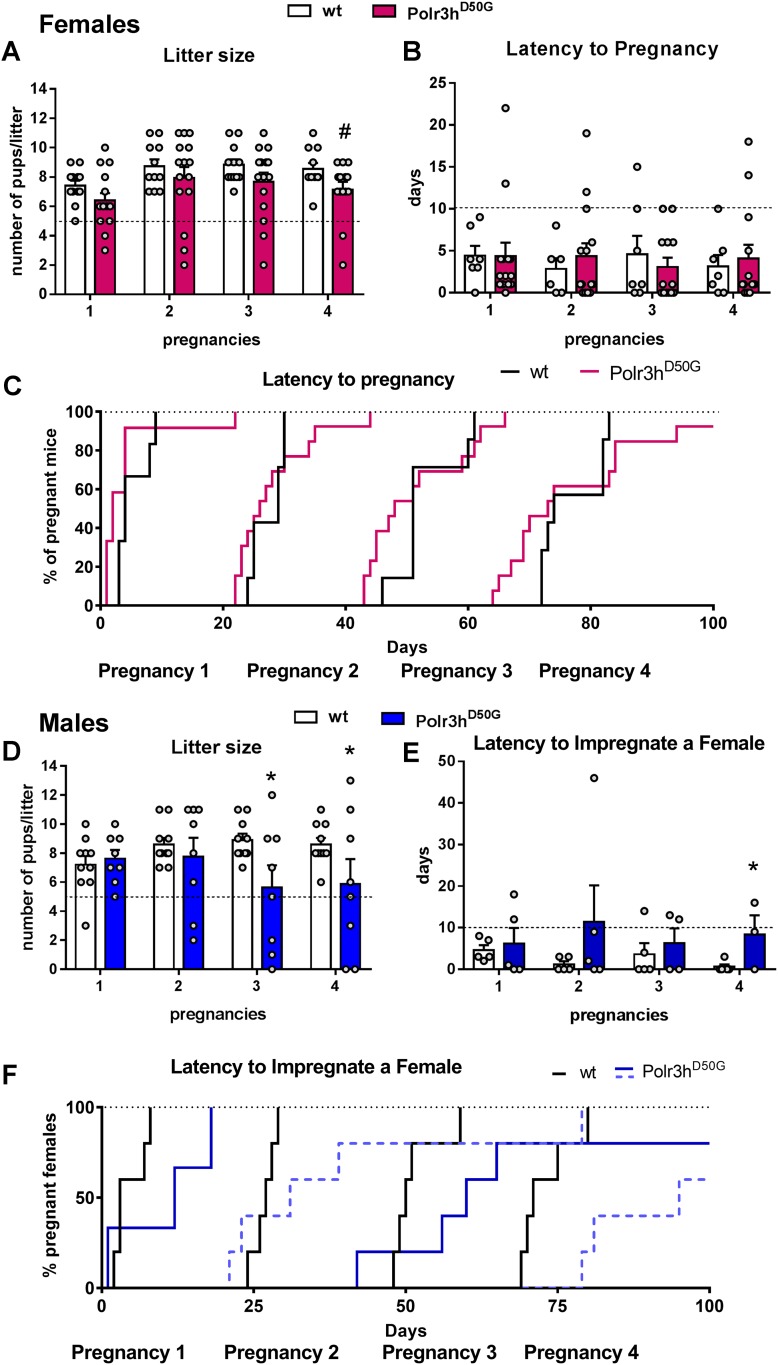
Figure 6.
Polr3h D50G mice show decreased fertility. (A–F) Graphs showing litter size and latency to pregnancy (or to impregnate a female) in 100 days of continuous breeding. For litter size, linear mixed model fit by Restricted Maximum Likelihood was used. The t tests used the Satterthwaite method (lmerModLmerTest). Formula: Litter.size ≈ Pregnancies + Genotype + (1/Mouse.ID). Female: df = 55.09, t = 1.7; #P = 0.08. Male: df = 49.53, Pregnancy 3: t = 2.4, *P = 0.01; Pregnancy 4: t = 2.0, *P = 0.04. Difference in (E) was observed via log-rank (Matel-Cox) test, *P = 0.04. Dashed black lines indicate threshold for comparison (5 pups per litter, 10 days for pregnancy and 100%).

