Figure 5.
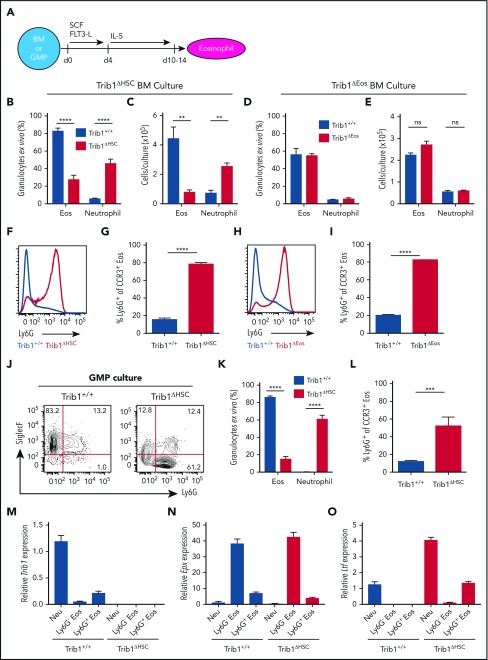
Trib1 represses the neutrophil (Neu) program ex vivo. (A) Schematic of ex vivo eosinophil differentiation assay. Frequency of live cells (B) and day 10 cell output (C) using Trib1+/+ or Trib1ΔHSC BM. Frequency: n = 5 mice per group, pooled from 3 experiments; cell output: n = 3 wells per group, representative of 4 experiments. Frequency of live (D) cells and day 10 cell output (E) using Trib1+/+ or Trib1ΔEos BM. Frequency: n = 3 mice per group, representative of 6 experiments; cell output: n = 3 wells per group, representative of 5 experiments. (F) Representative histogram of Ly6G expression on SiglecF+CCR3+ eosinophils from Trib1+/+ (blue) or Trib1ΔHSC (red) IL-5 cultures. (G) Frequency of Ly6G expression on SiglecF+CCR3+ cells at day 10; n = 3 mice per group, representative of 4 experiments. (H) Representative histogram of Ly6G expression on SiglecF+CCR3+ eosinophils from Trib1+/+ (blue) or Trib1ΔEos (red) IL-5 cultures. (I) Frequency of Ly6G expression on SiglecF+CCR3+ cells; n = 3 mice per group, representative of 6 experiments. Eosinophils gated CD11b+SiglecF+CCR3+; neutrophils gated CD11b+Ly6G+SiglecF−. (J) Representative plots of day 10 IL-5 cultures of sorted GMPs from Trib1+/+ and Trib1ΔHSC mice, gated on live, CD11b+ cells. (K) Quantification of Ly6G expression on SiglecF+CCR3+ cells at day 10 of IL-5 GMP culture; n = 3-5 wells per genotype, representative of 2 experiments. (L) Quantification of granulocyte output at day 10 IL-5 culture of sorted GMPs; n = 3-5 wells per genotype, representative of 2 experiments. qPCR analysis of sorted neutrophils (CD11b+Ly6G+SiglecF−), and Ly6G− and Ly6G+ eosinophils (CD11b+SiglecF+CCR3+) from day 10 IL-5 culture of Trib1+/+ and Trib1ΔHSC BM for Trib1 (M), Epx (N), and Ltf (O), relative to 18s, normalized to Trib1+/+ neutrophils; n = 3, representative of 2 experiments. **P < .0084; ***P = .0002; ****P < .0001; unpaired Student t test. Frequencies and error bars are mean ± SEM of live cells. SCF, stem cell factor.

