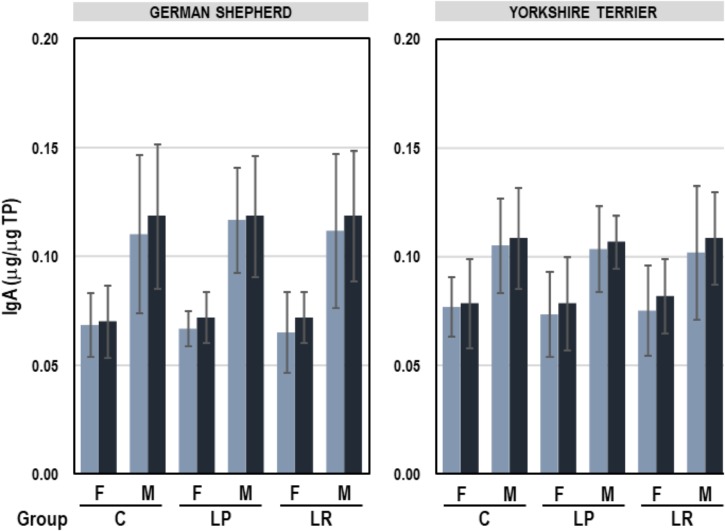
FIGURE 5.
IgA content (μg/μg TP) in feces of German shepherd and Yorkshire female (F) and male (M) puppies at the beginning (week 5, light blue) and at the end (week 12; dark blue) of the assay in the control (C), L. plantarum MP02 (LP) and L. rhamnosus MP01 (LR) groups. Paired t-tests were performed to analyze if the individual change in the concentration of IgA at the end of the assay was statistically significant in each group of dogs.

