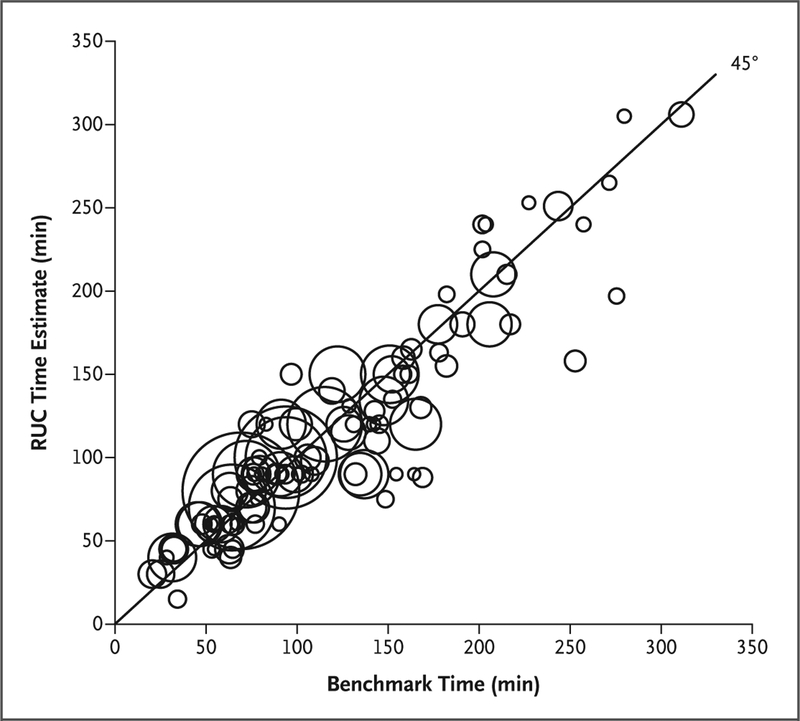
Figure 1. Relationship between RUC Time Estimates and Benchmark Times in 108 Reviews of Common Surgical Procedures.
Each bubble represents a surgical procedure reviewed by the Relative Value Scale Update Committee (RUC) from 2005 through 2015. Bubble size represents the frequency with which the procedures were performed, as recorded in the clinical registry maintained by the American College of Surgeons National Surgical Quality Improvement Program (NSQIP). Benchmark times were defined as mean times in the NSQIP data for the relevant procedure and calendar quarter. The 45-degree line indicates equivalence between the RUC time and the benchmark time, and the distance of bubbles from this line indicates the degree of discrepancy between the two time values.

