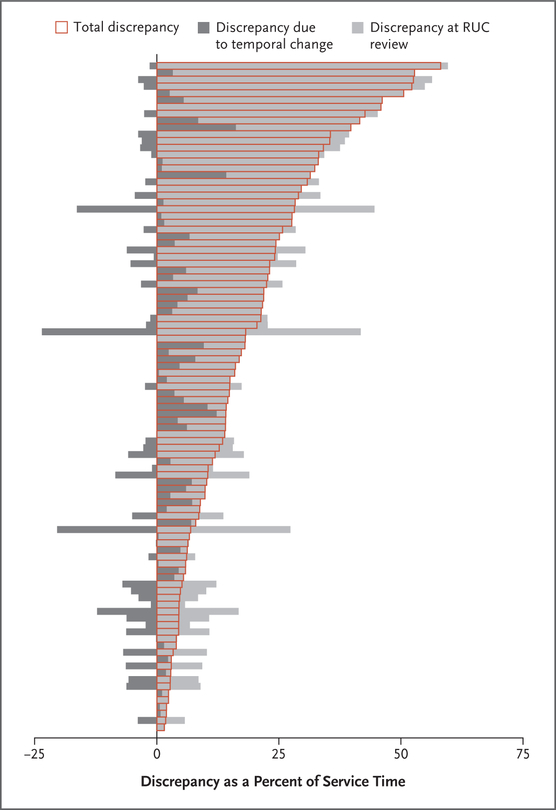
Figure 2. Discrepancies between RUC Time Estimates and Benchmark Times for 98 Common Surgical Procedures.
Shown are the components of discrepancy for each of 98 procedures performed, expressed as an average percentage deviation from the procedure’s benchmark time over the period of observation. Each bar represents a procedure. The light gray segment of each bar represents the initial discrepancy at the time of review. The dark gray segments represent temporal changes in procedure times after review. Dark gray segments to the left of the zero line indicate temporal changes that decreased discrepancy from the initial discrepancy; dark gray segments to the right of the zero line indicate temporal changes that increased discrepancy from the initial discrepancy. The boxes outlined in red indicate the total discrepancy after adding temporal changes to or subtracting them from the initial discrepancy.

