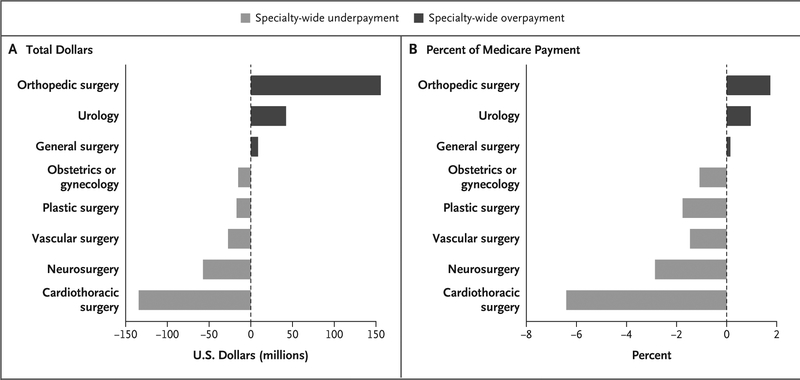
Figure 3. Effect of Inaccuracies in Time Estimates for 293 Procedures on Medicare Reimbursement for Eight Surgical Specialties, 2011–2015.
The bars show the differences, according to specialty, between actual Medicare payments and an estimate of counterfactual Medicare payments had the procedures been valued according to benchmark (NSQIP) times instead of RUC time estimates. Panel A shows the differences in dollars, and Panel B the differences as a percentage of all Medicare payments (i.e., for all services) made to physicians in the specialties. The dark gray bars to the right of the zero line indicate specialty-wide overpayment relative to the counterfactual amount. Light gray bars indicate specialty-wide underpayment.

