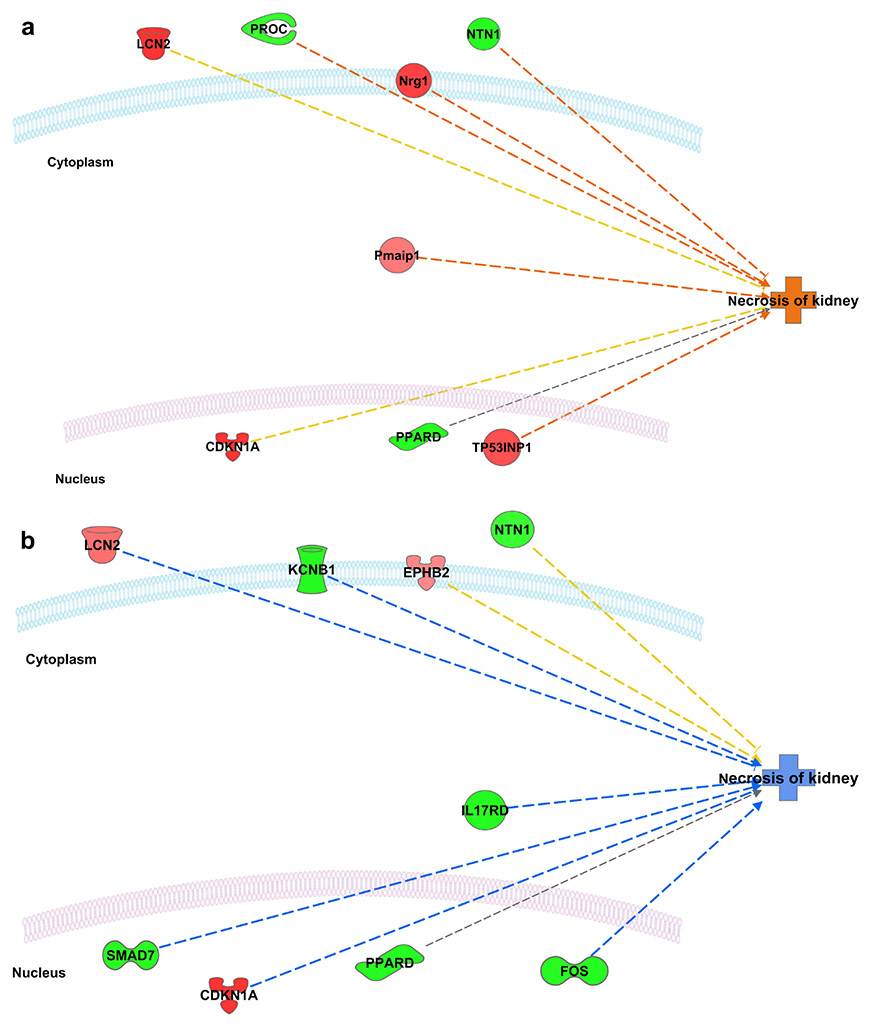
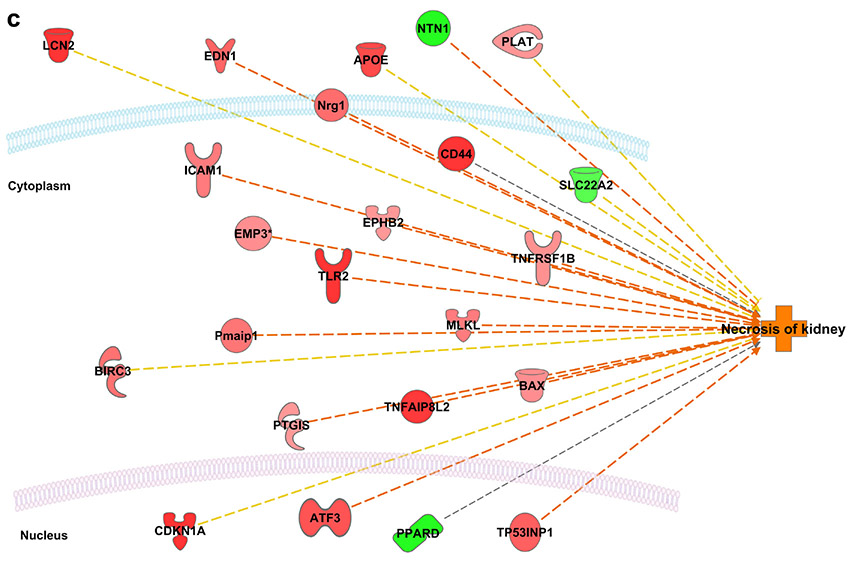
Figure 7.
Variation in “Necrosis of Kidney” Pathway Activity Ingenuity Pathway Analysis (IPA) prediction of the interactive network between the differentially expressed genes and the downstream function “necrosis of kidney”. Red, genes overexpressed; green, genes underexpressed; orange, function predicted to be activated; blue, function predicted to be inhibited. (A) Three days following the first dose (B) Two weeks following the first dose (C) Two weeks following the second dose. Changes in expression of Lcn2 (NGAL), CKDN1A (p21), MLKL and TLR2 were of particular interest given their known roles in injury response, cell cycle arrest, and regulated necrosis, respectively.


