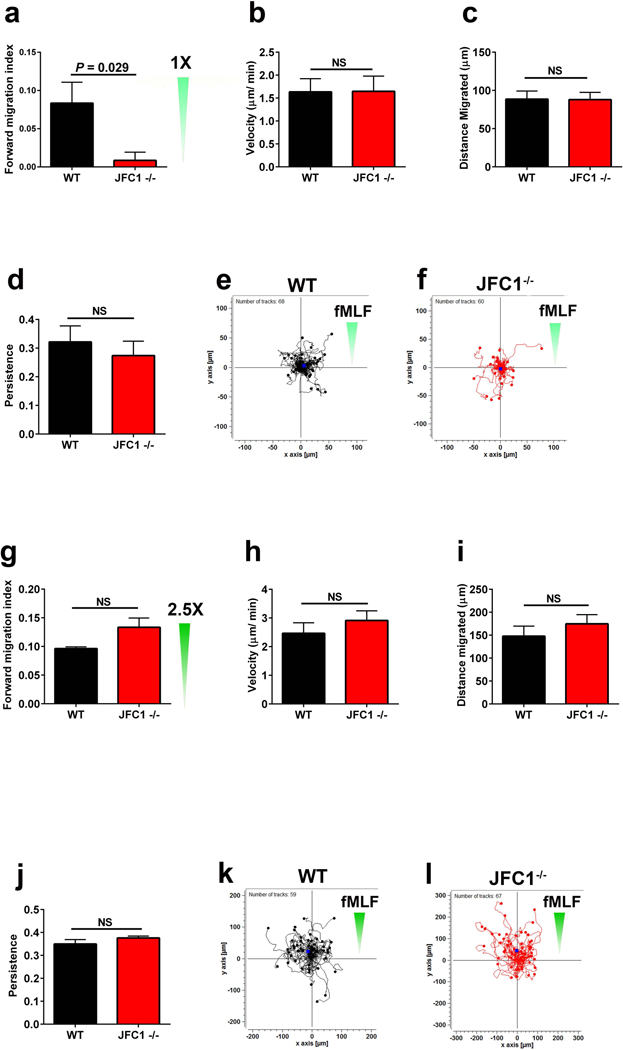
FIGURE 1: Directional migration is defective in JFC1−/− neutrophils.

(a-l) WT or JFC1−/− mouse bone marrow neutrophils were analyzed in chemotaxis using collagen-coated ibidi μ-slide chemotaxis chambers. Gradients were generated using 10 μM fMLF (a-f) or 25 μM fMLF (g-l) at the chemoattractant reservoir, which produces 0 to 10 or 25 μM fMLF gradients at 30 minutes (see methods and results sections). Cell movement was recorded at 2 min intervals for 1 hour and tracks for the cells were mapped using the Manual Tracking plug-in of ImageJ software. The forward migration index (efficiency of directed cell migration) (a and g), mean velocity (b and h), distance migrated (c and i) and persistence (d and j) were calculated using the Chemotaxis and Migration Tool software (Ibidi). The results are expressed as mean ± SEM from at least 3 independent experiments (n=6 for a-d and n=3 for g-j), *p<0.05; NS, not significant. (e, f, k and l) Data showing tracks of cell migration from one representative experiment. Distance from the origin is indicated on x and y axes in μm. The direction of the chemotactic gradient is indicated with green triangles.
