
Figure 3: F-actin dynamics and calcium release upon fMLF stimulation are unaffected in JFC1−/− neutrophils.
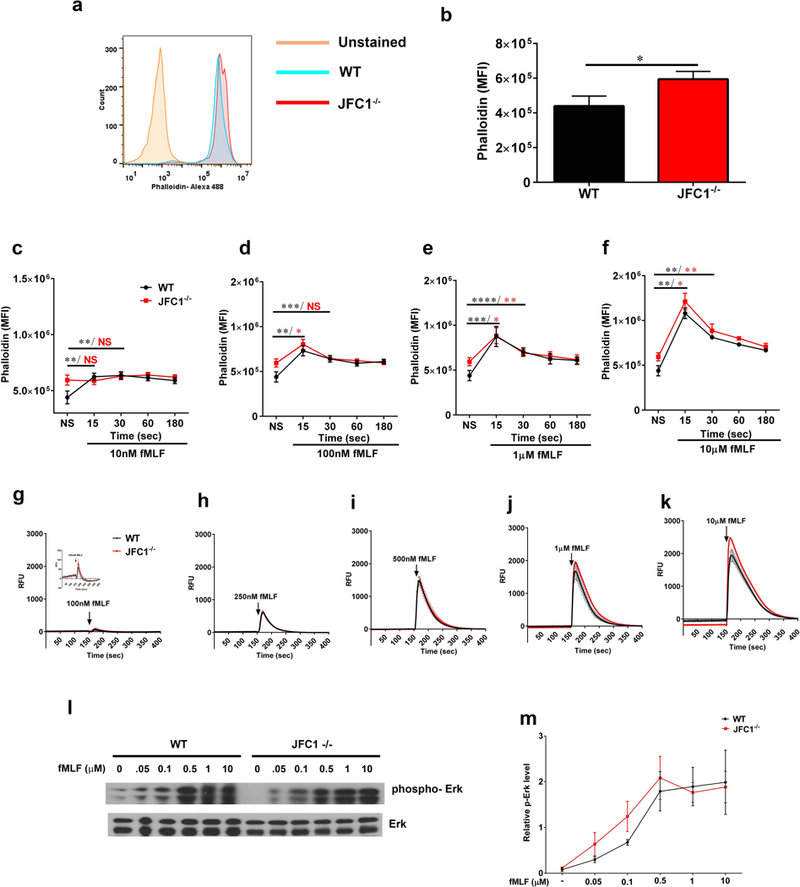
(a-f) Quantitative analysis of actin remodeling. Mouse bone marrow neutrophils from WT or JFC1−/− mice were left unstimulated (a, b) or were stimulated with either 10nM (c), 100nM (d), 1μM (e) or 10μM (f) fMLF for the indicated times at 37° C. The cells were then fixed, actin stained using Phalloidin-488 and the cells were analyzed by flow cytometry. The mean fluorescence intensity was calculated using FlowJo software. a. Representative histogram showing the basal F-actin levels in WT and JFC1−/− neutrophils. b. Quantitative analysis of the basal F-actin levels in WT vs JFC1−/− neutrophils. Mean ± SEM from 8 mice, * p<0.05. (c-f) Time course of actin polymerization at the indicated fMLF concentration. Data are indicated as mean ± SEM from 3 WT (shown in black) and 3 JFC1−/− (shown in red) mice. * p<0.05, ** p<0.01, *** p<0.001, **** p< 0.0001. (g-k) Quantitative analysis of calcium flux. Mouse bone marrow neutrophils were seeded onto poly D-lysine coated plates and loaded with Fluo8, a fluorescent calcium sensitive indicator for 30 min. Calcium levels were measured by monitoring the fluorescence intensity at Ex/Em = 490/525 nm using the FLIPR-384 system over time. fMLF was added at the 150 sec time point after beginning the read. Mean ± SEM from 3 WT (shown in black) and 3 JFC1−/− (shown in red) mice. (l) Western blot analysis of neutrophil signaling in response to fMLF activation. Mouse bone marrow neutrophils from WT or JFC1−/− mice were left unstimulated or were stimulated with either 50 nM, 100 nM, 500 nM, 1 μM or 10 μM fMLF for 2 minutes at 37° C. Immunoblots are representative of four independent experiments. (m) Quantification of Erk phosphorylation was performed by densitometry. The intensity of phosphorylated Erk was normalized to that of total Erk to calculate relative p-Erk levels. Data are represented as mean ± SEM from an n=4 mice.