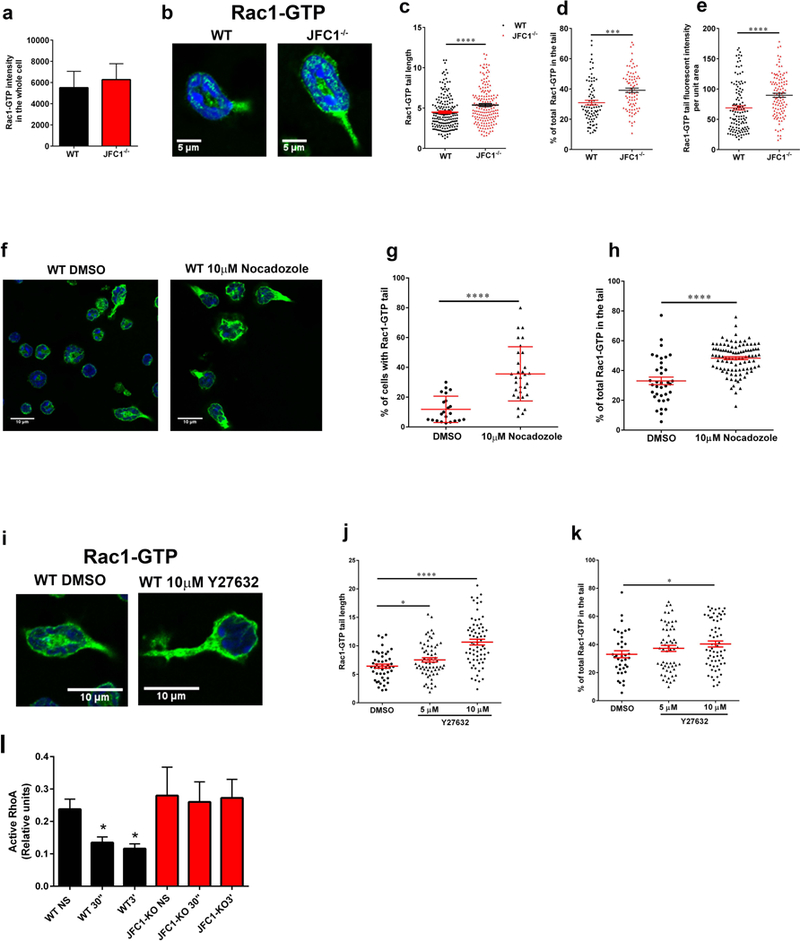
FIGURE 6: JFC1−/− neutrophils show increased Rac1-GTP tail length and accumulation of Rac1-GTP at the uropod.

(a-e) Comparative quantitative analysis of the localization of endogenous active Rac1 in stimulated wild type and JFC1−/− neutrophils. (a) Quantitative analysis of total Rac1-GTP in neutrophils isolated from WT and JFC1−/− mice after stimulation with 100nM fMLF for 10 min at 37 °C. Active Rac1 was quantified using an antibody specific for the GTP bound form of Rac1 as described under “Material and Methods” and Rac1-GTP fluorescence intensity in the whole cell was analyzed using ImageJ. The data is indicated as mean± SEM of the arbitrary fluorescent units from an n=3 mice. (b) Representative images of WT and JFC1−/− cells showing Rac1-GTP accumulation in the tail upon fMLF stimulation for 10 min. (c) The length of Rac1-GTP uropods was analyzed using the ImageJ software. The data is expressed as mean ± SEM from a total of 180 cells from 3 independent experiments. (d) The % of total Rac1-GTP accumulated in the tail for each cell was calculated from the fluorescent intensity of Rac1-GTP in the uropod relative to the whole cell, measured using the ImageJ software. (e) The tail area was measured and Rac1 tail intensity per unit area was calculated using ImageJ. (c-e). WT (black circles); JFC1−/− (red triangles). Data are represented as mean ± SEM and were obtained from an n=4 mice. *** p<0.001, **** p<0.0001. (f-k) Effects of microtubule disruption (f-h) or ROCK inhibition (i-k) on the distribution of endogenous active Rac1 in WT neutrophils. Isolated neutrophils were seeded onto glass coverslips for 30 min, treated with the indicated inhibitors and stimulated with 100nM fMLF for 10 min at 37 °C. Active Rac1 was quantitatively analyzed by confocal microscopy as described above. (f) Representative image of WT and JFC1−/− cells showing Rac1-GTP accumulation in the tail upon treatment with 10μM Nocadozole followed by fMLF stimulation. (g) Percentage of total cells expressing Rac1-GTP-positive tails. (h) % of total (whole cell) Rac1-GTP accumulated in the tail for each Nocodazole- or vehicle-treated cell. (i) Representative images of WT and JFC1−/− cells showing Rac1-GTP accumulation in the tail upon treatment with 10μM Y27632 prior to fMLF stimulation. (j) The length of the Rac1-GTP tails in vehicle vs Y27632-treated cells. The data is expressed as mean ± SEM obtained from 3 independent experiments. (k) Percentage of total Rac1-GTP accumulated at the uropods of Y27632 or vehicle treated cells. n=3 mice. Mean ± SEM. (l) Quantitative analysis of RhoA activity in wild type (WT) and JFC1−/− neutrophils that have been left untreated (NS) or stimulated with fMLF for 30 seconds (30”) or for 3 minutes (3’). Mean ± SEM, n=3. *, p<0.05.
