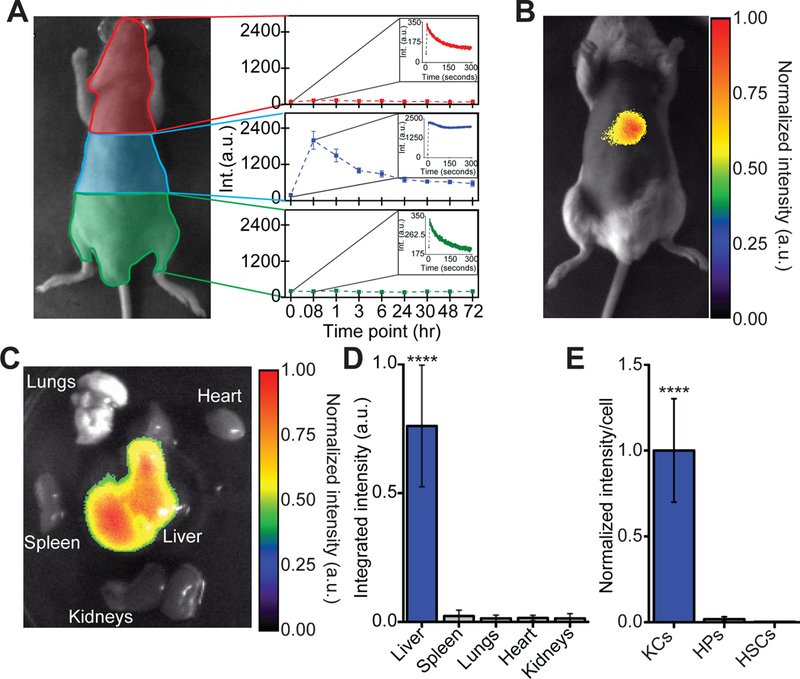
Fig. 2. Reporter biodistribution.

(A) Quantification of fluorescence over time in different regions of mice after intravenous injection of ssCTTC3TTC-SWCNT. Results are averaged for 5 mice and error bars represent standard deviation. Insets represent the average fluorescence intensity in the specified region immediately following injection. Error bars have been removed for clarity (B) Fluorescence image of the reporter in vivo in a mouse, twenty-four hours after intravenous injection (200 ng). (C) Fluorescence image of the reporter in mouse organs ex vivo, twenty-four hours after injection as in (B). (D) Quantification of ssCTTC3TTC-SWCNT emission spectra ex vivo obtained with a near-infrared spectroscope. ****P < 0.0001 versus other groups, one way ANOVA with Dunnet’s post test error bars represent standard deviation, N=3 mice per group. (E) Quantification of ssCTTC3TTC-SWCNT emission in isolated murine Kupffer cells (KCs), hepatocytes (HPs), and hepatic stellate cells (HSCs), 24 hours after intravenous injection. ***P < 0.001, one way ANOVA with Tukey’s post test, N=49–62 cells per group, error bars represent standard error of the mean.
