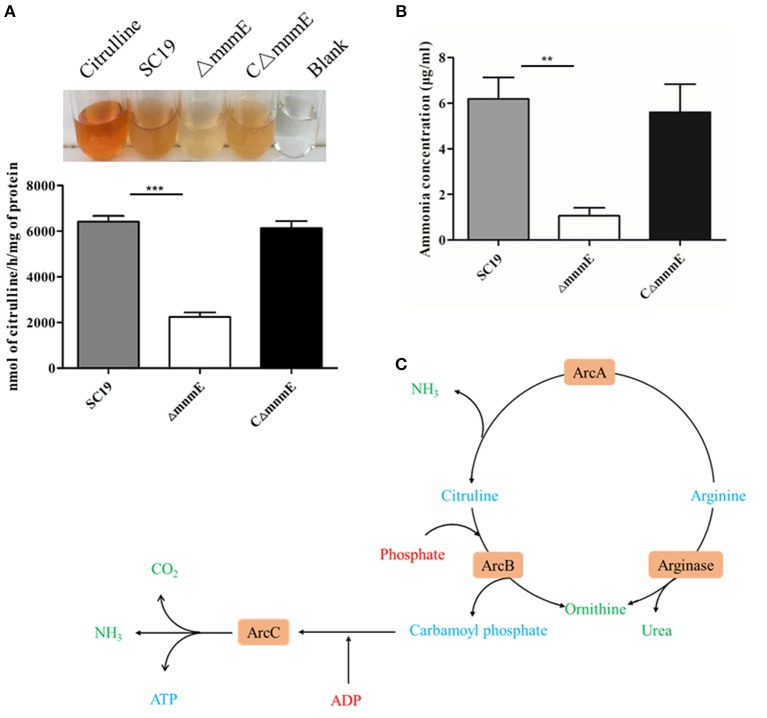
Figure 4.
Regulation of the ADS by MnmE. (A) AD activities of different S. suis. Results were expressed as nanomoles of citrulline produced per hour per milligram of whole cell protein. (B) Production of ammonia in different S. suis. Ammonia production in supernatant of different S. suis is given as μg ammonia / ml. Data are presented as the mean ± SEM of a representative experiment performed intriplicate. Statistical significance was determined by two-tailed t-test (**p < 0.01; ***p < 0.001). (C) Schematic representation of S. suis arginine metabolic pathways. The core ADS enzymes (ArcA, ArcB, ArcC) facilitating the conversion from arginine to ornithine are depicted in orange. Metabolic intermediates are indicated in blue. The input of energy in terms of phosphate or phosphate derivatives (ADP) are marked in red, non-catabolized, and excreted products have a green color.

