Figure 5.
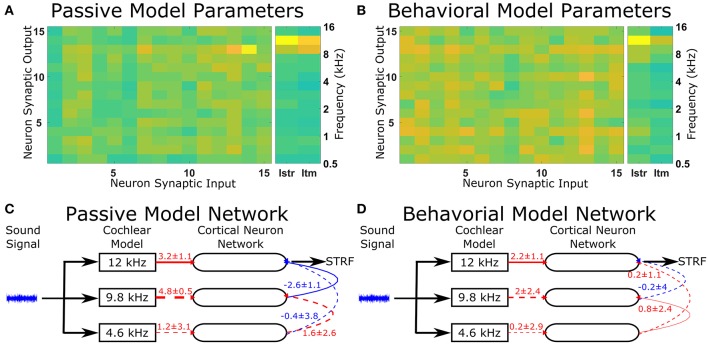
Changes in the network structure to reproduce experimental observations. The mathematical model can reproduce physiological recordings from the passive and behavioral states (Figure 4). To understand the changes in the network structure, the optimization was repeated five times and a sensitivity analysis was performed for each solution. (A,B) The average sensitivity analysis of the five solutions for both the passive (A) and behavioral (B) states. Both (A,B) contain two matrices, one 15-by-15 matrix and one 2-by-15 matrix. The 15-by-15 matrix represents the synaptic connections between all 15 neurons, with the y-axis representing the neuron number providing the synaptic output and the x-axis representing the neuron number receiving the synaptic. The 2-by-15 matrix represents the input from the cochlea model to the cortical neuron network, where Istr is the strength of the synaptic input and Itm is the length of the time delay for the synaptic input. The frequency axis on the far right hand side indicates the center frequency tuning for each neuron number. For clarity, if the sensitivity analyses were not in the top two values for either the passive or behavioral state, the value is not shown. (C,D) The network schematic diagram indicating the average values of the network parameters for the passive (C) and behavioral (D) states. Solid lines indicate that parameter had a high sensitivity (the two most sensitive parameters over five repetitions of the optimization) for that state, whereas dashed lines indicate the parameter was sensitive for the other state or were required to follow the network path from the sound signal to the neuron from which the STRF was calculated. Red lines indicate excitatory synaptic connections, blue lines indicate inhibitory synaptic connections, and the thicknesses of the lines indicate the strength of the synaptic connections. The numerical values presented for each line indicate the mean ± standard deviation for the five repetitions of the optimization.

