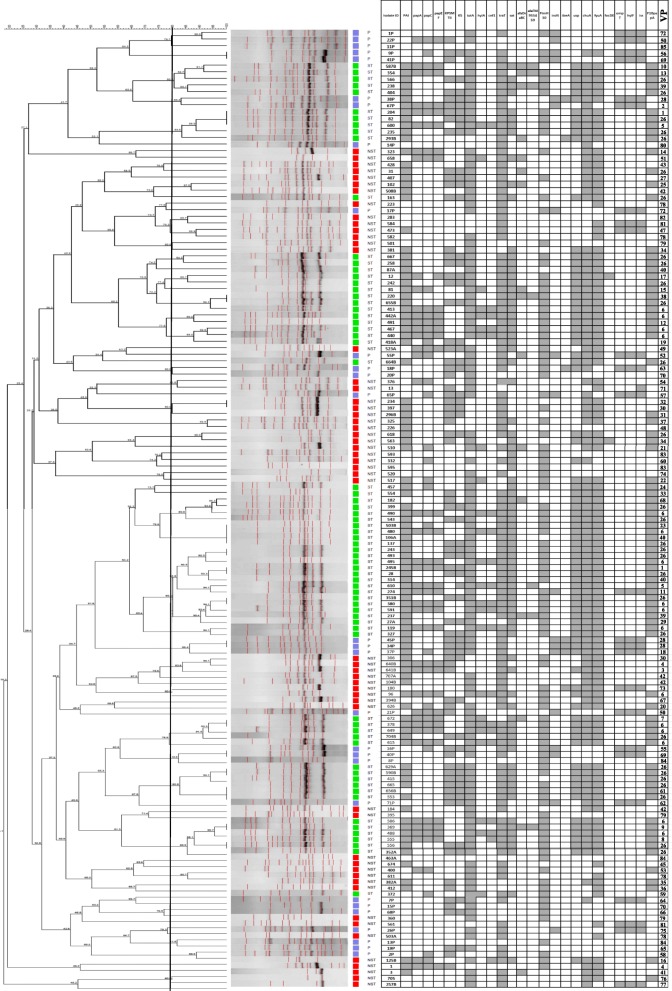
Fig. 1.
ERIC-PCR based dendogram of the 152 E.coli isolates and virulence gene profile. Cluster analysis of the Dice similarity indices based on the unweighted pair group method using average linkages (UPGMA) was done to generate a dendogram describing the relationship among the ERIC profiles. (One non-ST131 isolate didn’t amplify in ERIC-PCR, so it is not included in the dendogram image). P, poultry (broilers); ST, ST131; NST, non-ST131; VP, virulence profile number. Filed squares indicate the presence of the gene

