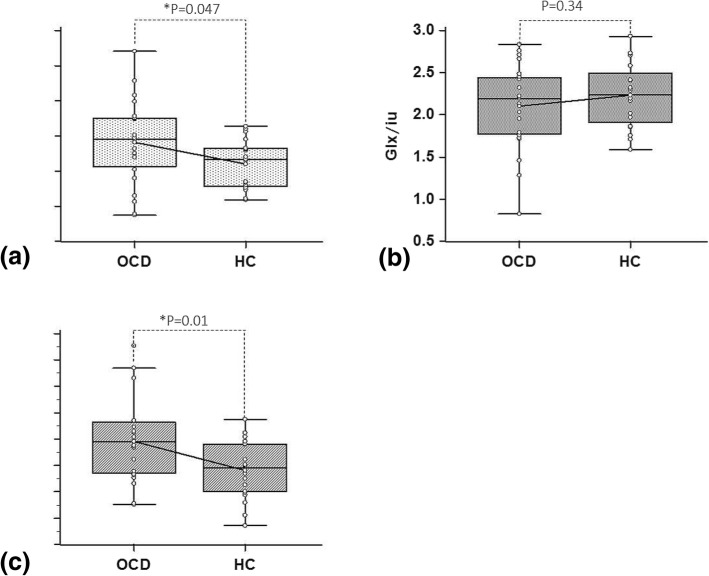
Fig. 3.
Comparison between OCD and HC groups in a GABA+, b Glx and c GABA+/ Glx values. Significant differences between the OCD and HC groups were observed in the level of GABA+ and the GABA+/Glx ratio. The OCD group showed a higher level of GABA+ and a higher GABA+/Glx ratio than the control group. By contrast, no significant differences between the OCD and HC groups were observed in the level of Glx

