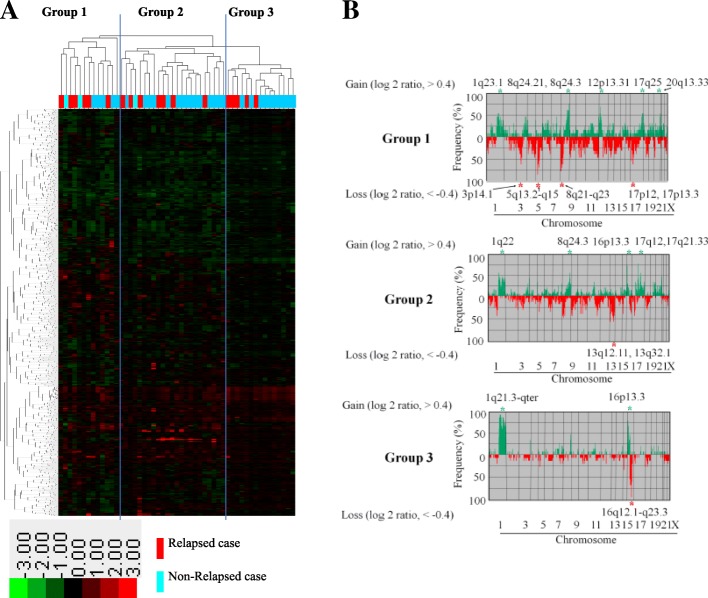
Fig. 2.
a Unsupervised hierarchical cluster analysis of genome copy number profiles measured for 51 pN0 breast cancers. In the horizontal direction, tumor samples are arranged; non-relapsed cases are indicated in light blue, and relapsed cases in red. In the vertical direction, the genes to which the gene copy number was assigned were examined, arranged, and largely classified into two clusters. Gene copy-number gains and losses are indicated by red and green, respectively. A total of 51 tumor samples were classified into three major clusters: groups 1, 2, and 3. b Significant differences in genome copy number alteration patterns among groups 1, 2, and 3. In group 1, gains in 1q23.1, 8q24.21, 8q24.3, 12p13.31, 17q25, and 20q13.33 and losses in 3q14.1, 5q13.2-q15, 8p21-q23, 17p12, and 17p13.3 were common. In group 2, gains in 1q22, 8q24.3, 16p13.3, 17q12, and 17q21.33 and losses in 13q12.11 and 13q32.1 were common. In group 3, gains in 1q21.3-qter and 16p13.3 and losses in 16q12.1-q23.3 were common

