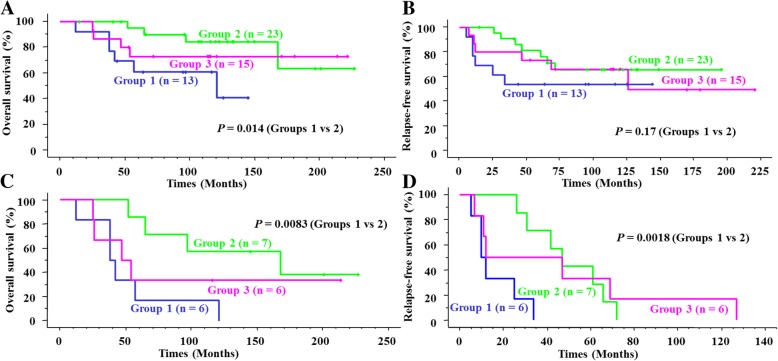
Fig. 3.
Kaplan-Meier survival curves for the three clusters. (a and b) Overall survival (OS) (a) and relapse-free survival (RFS) (b) curves for all 51 pN0 breast cancers. Group 1 shows significantly worse OS than does group 2 (p = 0.014). c and d OS (c) and RFS (d) curves for 19 relapsed pN0 breast cancers. Group 1 shows significantly lower OS and RFS rates than group 2 (p = 0.0083 and 0.0018, respectively)

