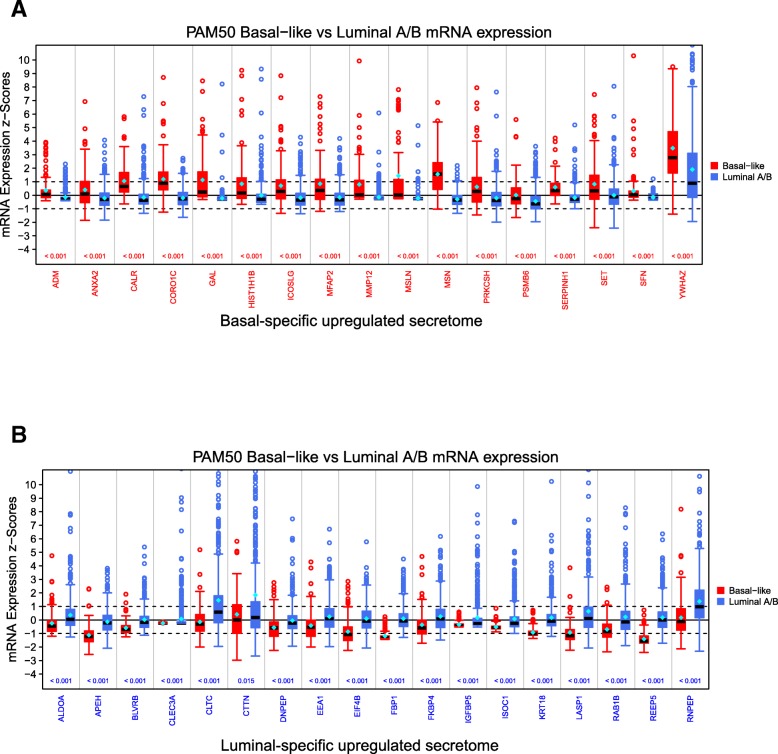
Fig. 4.
Box plots showing the statistically significant altered mRNA expression (x-axis) for a BLBC and b luminal secreted proteins among TCGA patients. The distribution of mRNA expression for BLBC patients is shown in red on the left, and for luminal A/B patients in blue on the right. The z-scored mRNA expression is displayed on the y-axis. Values > 1 are considered to be significantly up-regulated, values < − 1 to be significantly downregulated, and values between − 1 and 1 are considered “not altered”. The median value is displayed as a black bar inside the box. A Mann-Whitney-Wilcoxon Test to ascertain the expression differences between the two PAM50-subtypic populations was performed. The p-value is displayed above the x-axis with p-values < 0.05 colored red if expression is higher for BLBC and blue if expression is higher for luminal samples

