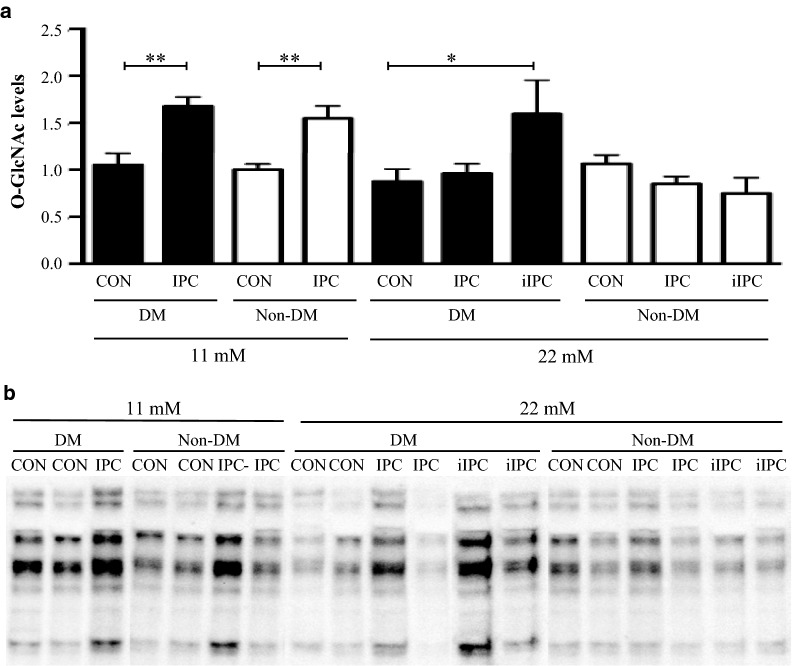
Fig. 4.
a O-GlcNAc (CTD110.6 antibody) levels in diabetic (DM) Control, Non-DM Control, DM ischemic preconditioned (IPC), Non-DM IPC, DM intensified ischemic preconditioned (iIPC) and Non-DM iIPC hearts expressed as fold change compared to 11 mmol/L Non-DM Control and correlated against total protein. b Representative O-GlcNAc bands. Note the higher intensity in the preconditioned compared with corresponding control hearts. *p < 0.05, **p < 0.01. Mean ± SEM

