. 2018 Mar 10;35(1):87–91. doi: 10.5511/plantbiotechnology.18.0122b

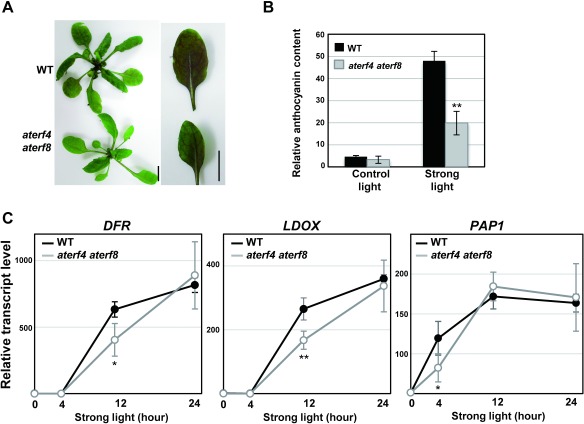
Figure 3. Responses of intact WT and aterf4 terf8 plants after being transferred to the strong light condition. (A) Photographs of the rosettes (left) and the intact leaves (right) of WT and aterf4 terf8 at two days after being transferred to the strong light condition. Bars=1 cm. (B) Measurement of the relative anthocyanin content in the intact WT and aterf4 aterf8 leaves. The sixth leaves were harvested at 0 or 2 day after being transferred to the strong light condition. The values are presented as arbitrary units, and error bars indicate standard deviation of 12 biological replicates. Asterisks represent significant differences compared with the WT values by a Student’s t-test (**p<0.01). (C) The transcript levels of DFR, LDOX, and PAP1 in the intact leaves of WT and aterf4 aterf8 plants at indicated time points after being transferred to the strong light condition. A detailed description is presented in the legend of Figure 1D.

Figure 3. Responses of intact WT and aterf4 terf8 plants after being transferred to the strong light condition. (A) Photographs of the rosettes (left) and the intact leaves (right) of WT and aterf4 terf8 at two days after being transferred to the strong light condition. Bars=1 cm. (B) Measurement of the relative anthocyanin content in the intact WT and aterf4 aterf8 leaves. The sixth leaves were harvested at 0 or 2 day after being transferred to the strong light condition. The values are presented as arbitrary units, and error bars indicate standard deviation of 12 biological replicates. Asterisks represent significant differences compared with the WT values by a Student’s t-test (**p<0.01). (C) The transcript levels of DFR, LDOX, and PAP1 in the intact leaves of WT and aterf4 aterf8 plants at indicated time points after being transferred to the strong light condition. A detailed description is presented in the legend of Figure 1D.