. 2018 Mar 28;35(1):39–49. doi: 10.5511/plantbiotechnology.18.0129b

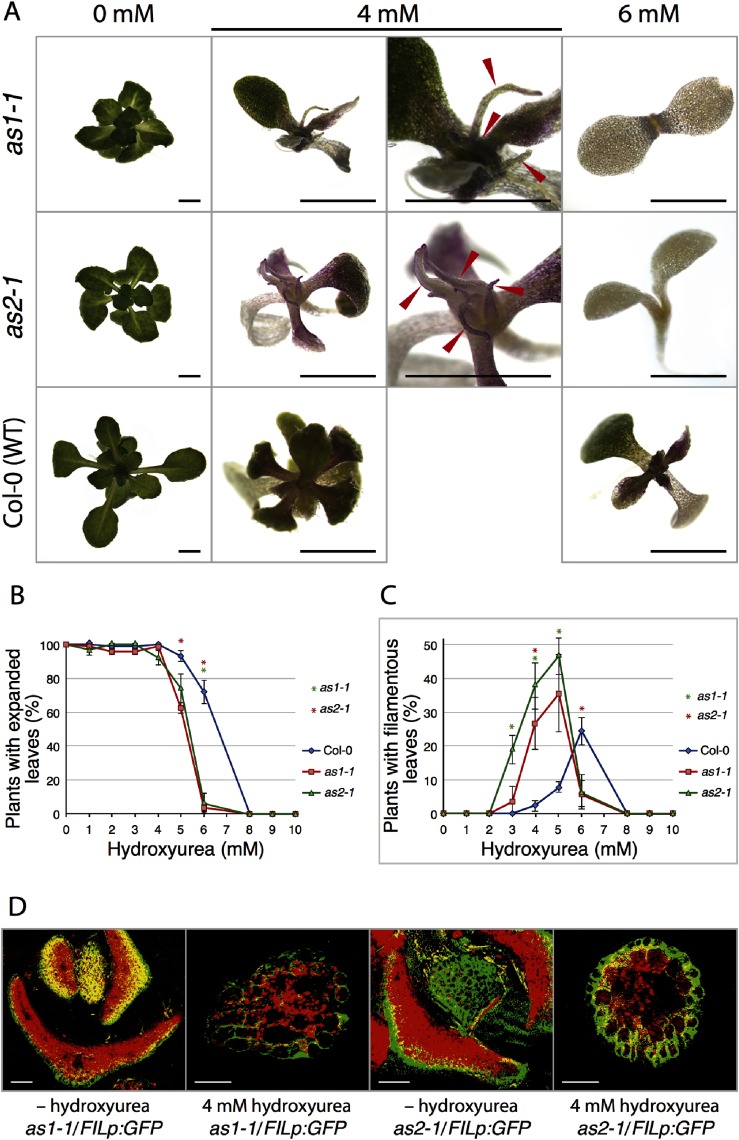
Figure 1. Effects of hydroxyurea on as1-1 and as2-1 mutants. (A) Phenotypes of Col-0, as1-1, and as2-1 plants grown on agar plates in the presence and the absence of 4 mM, 6 mM hydroxyurea. Red arrowheads on as1-1 and as2-1 plants show filamentous leaves. Scale bars=2 mm. (B) Frequencies of plants that have true leaves grown in the presence and in the absence of hydroxyurea. Frequency is defined as the ratio of the number of plants having expanded leaves to the total number (n=30) of plants examined. Plants were grown at 22°C. Observations were performed at 21 days after sowing. Bars represent the s.d. from three biological replicates. (C) Frequencies of plants with filamentous leaves grown in the presence and in the absence of hydroxyurea. Frequency is defined as the ratio of the number of plants with more than one filamentous leaf to the total number (n=30) of plants examined. Plants were grown at 22°C. Observations were performed at 21 days after sowing. Bars represent the s.d. from three biological replicates. (D) as1-1/FILp:GFP and as2-1/FILp:GFP plants were grown on medium with and without 4 mM hydroxyurea for 21 days. Expression patterns of FILp:GFP in transverse sections of leaves are shown. Green signals due to GFP; red, autofluorescence. Yellow signals were due to both GFP and autofluorescence. Scale bars=50 µm. Significant differences from wild type were evaluated by Student’s t-test and are represented by asterisks (* p<0.01) in (B) and (C).

Figure 1. Effects of hydroxyurea on as1-1 and as2-1 mutants. (A) Phenotypes of Col-0, as1-1, and as2-1 plants grown on agar plates in the presence and the absence of 4 mM, 6 mM hydroxyurea. Red arrowheads on as1-1 and as2-1 plants show filamentous leaves. Scale bars=2 mm. (B) Frequencies of plants that have true leaves grown in the presence and in the absence of hydroxyurea. Frequency is defined as the ratio of the number of plants having expanded leaves to the total number (n=30) of plants examined. Plants were grown at 22°C. Observations were performed at 21 days after sowing. Bars represent the s.d. from three biological replicates. (C) Frequencies of plants with filamentous leaves grown in the presence and in the absence of hydroxyurea. Frequency is defined as the ratio of the number of plants with more than one filamentous leaf to the total number (n=30) of plants examined. Plants were grown at 22°C. Observations were performed at 21 days after sowing. Bars represent the s.d. from three biological replicates. (D) as1-1/FILp:GFP and as2-1/FILp:GFP plants were grown on medium with and without 4 mM hydroxyurea for 21 days. Expression patterns of FILp:GFP in transverse sections of leaves are shown. Green signals due to GFP; red, autofluorescence. Yellow signals were due to both GFP and autofluorescence. Scale bars=50 µm. Significant differences from wild type were evaluated by Student’s t-test and are represented by asterisks (* p<0.01) in (B) and (C).