. 2018 Mar 30;35(1):59–70. doi: 10.5511/plantbiotechnology.18.0202a

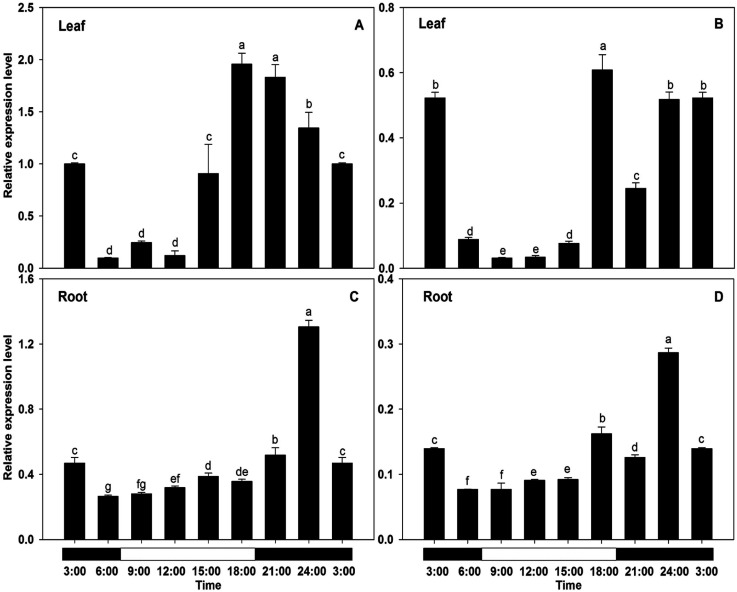
Figure 9. Effect of the circadian cycle on the expression of BcAMT2 and BcAMT2like in Brassica campestris. A, B: expression of BcAMT2 and BcAMT2like in leaves; C, D: expression of BcAMT2 and BcAMT2like in roots. Each value represents the mean±SE (n=3). Different lowercase letters indicate significant differences at p<0.05.

Figure 9. Effect of the circadian cycle on the expression of BcAMT2 and BcAMT2like in Brassica campestris. A, B: expression of BcAMT2 and BcAMT2like in leaves; C, D: expression of BcAMT2 and BcAMT2like in roots. Each value represents the mean±SE (n=3). Different lowercase letters indicate significant differences at p<0.05.