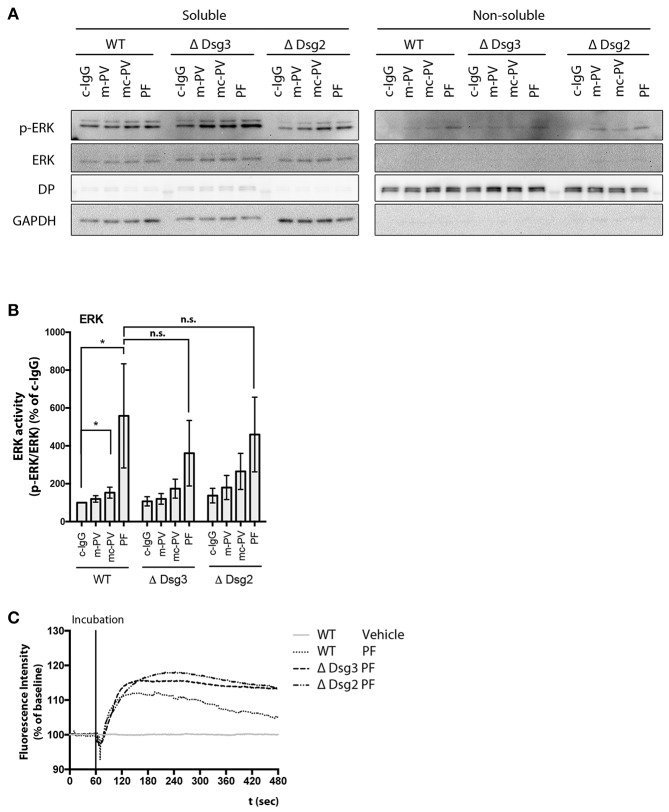
Figure 6.
Signaling pathway modulation by pemphigus IgG fractions in Dsg-deficient cell lines. Analysis of ERK activation after 30 min application of IgG fractions by immunoblot in Dsg3- and Dsg2-deficient cell lines. (A) Representative immunoblot and (B) densitometric analysis (n = 9, two-way ANOVA, *p ≤ 0.05). (C) Representativ graph of Fura-2 ratiometric Ca2+ imaging reveals a PF-IgG mediated Ca2+ influx in all cell lines used (n = 3).

