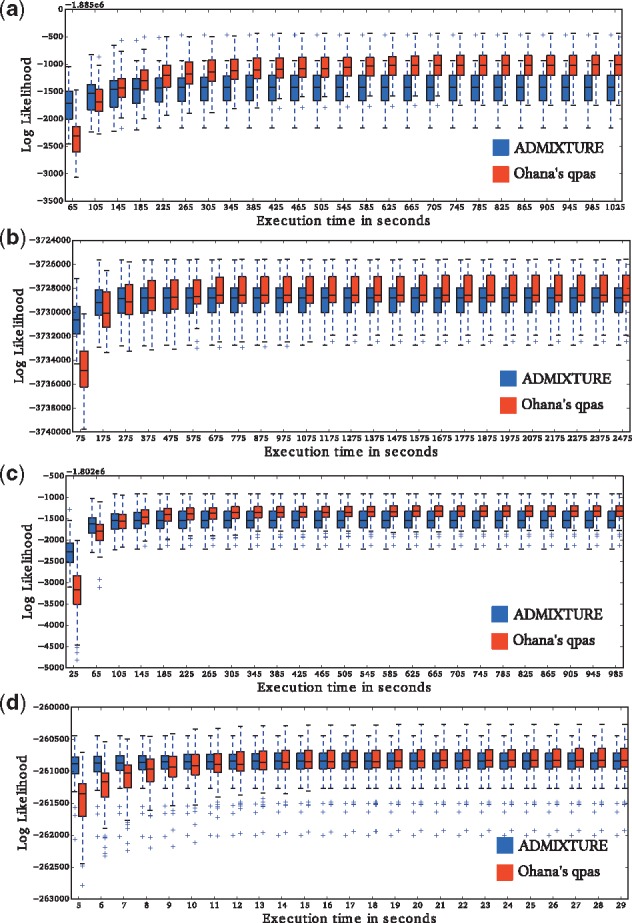
Fig. 2.

Comparison of computational speed and efficacy with ADMIXTURE. The plots show the change in the distribution of log likelihood values, produced from the two programs over time. Our method produces lower likelihood values initially, but it generally outperforms ADMIXTURE after relatively few iterations. For each dataset, each program was executed 100 times using random seeds () and K = 9. (a, b, c, d) are four different datasets, same as in Table 1
