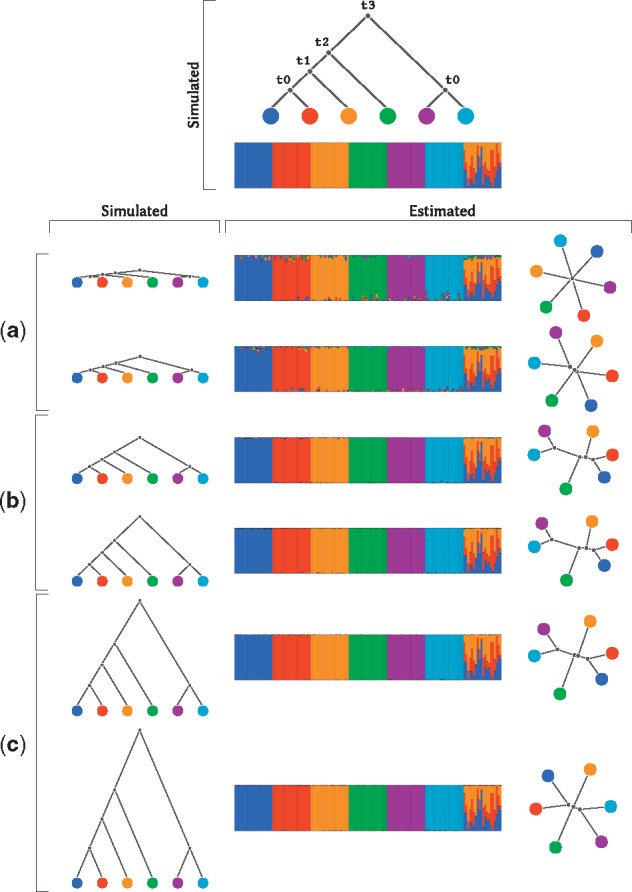
Fig. 4.

A simulation study for different divergence times. We simulated 140 individuals in 7 groups, 20 individuals per group. The first 6 groups were un-admixed. The last group was an equal mixture of the first 3 groups. We illustrate the simulated demography on the top. We simulated 6 divergence scenarios, 2 short shown in (a), 2 medium shown in (b) and 2 long shown in (c). From the shortest to the longest divergence scenario (top to bottom), the split times (t0, t1, t2, t3) in generation were: (10, 20, 30, 40), (100, 200, 300, 400), (1000, 2000, 3000, 4000), (1500, 3000, 4500, 6000), (10000, 20000, 30000, 40000), (20000, 40000, 60000, 80000)
