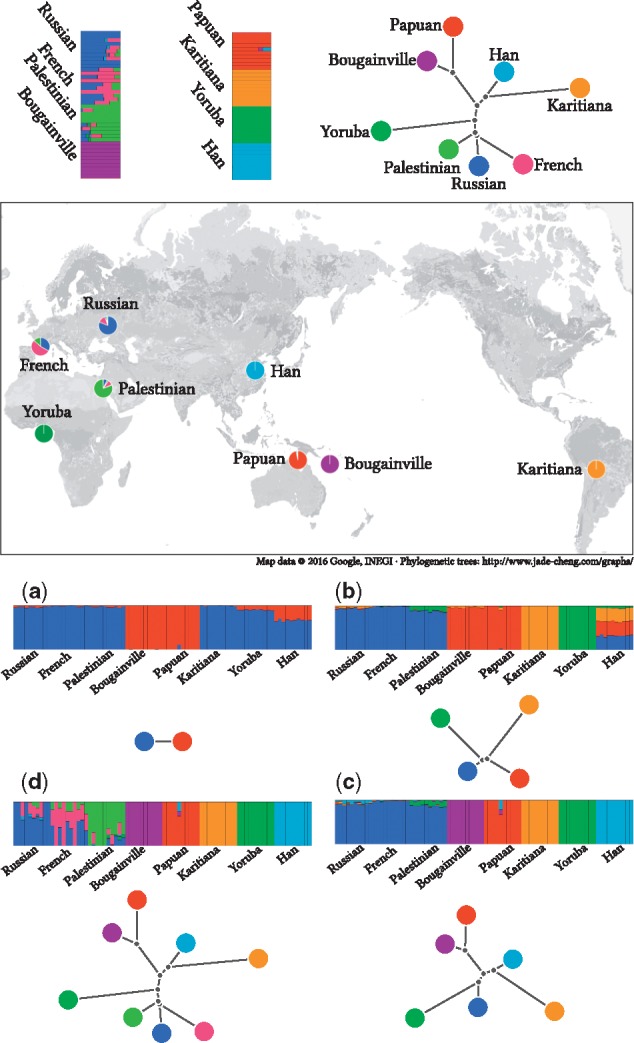
Fig. 5.

Analysis of human global data. We used a dataset compiled from the HGDP project containing 80 individuals from 8 populations, 10 per population. We filtered markers using Plink (Purcell et al., 2007) with options –indep 50 5 2 –geno 0.0 –maf 0.05. A total of 125 787 markers survived the filtration and were used for the analysis. For each K value, we dispatched 32 executions with random seeds from 0 to 31. We report only results from the execution that reached the best likelihood for each K. The plots show individual admixture proportions and population trees for several different values of K. The map combines the admixture results and geographical records of the HGDP samples. Each slice of each pie chart shows the sum of one component estimated in samples collected at that region. (a, b, c and d) show the admixture and tree estimates for , respectively
