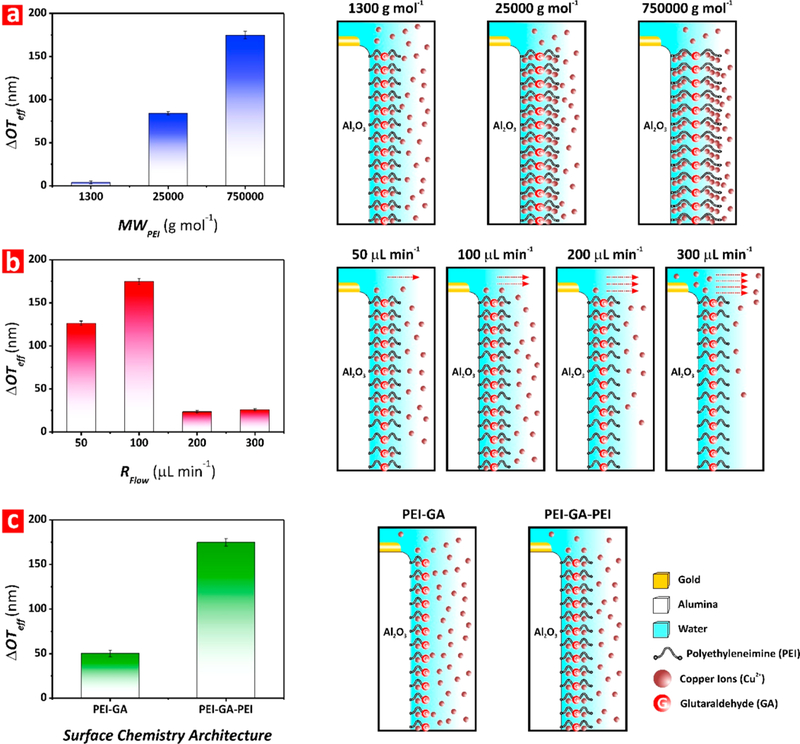
Figure 3.

Optimization of working parameters to maximize sensing of Cu2+ ions in NAA interferometers (note: error bars denote standard deviation from average measurements obtained from n = 3 independent experiments). (a) Bar chart showing the ΔOTeff associated with each molecular weight of PEI assessed in this study (i.e., MWPEI = 1 300, 25 000, and 750 000 g mol–1) (left) and illustration showing the effect of this working parameter on the sensing performance of PEI-GA-PEI-modified NAA interferometers (right). (b) Bar chart showing the ΔOTeff associated with each flow rate of analytical solution assessed in this study (i.e., RFlow = 50, 100, 200, and 300 μL min–1) (left) and schematic showing the effect of this working parameter on the sensing performance of PEI-GA-PEI-modified NAA interferometers (right). (c) Bar chart showing the ΔOTeff associated with each surface chemistry architecture assessed in this study (i.e., PEI-GA and PEI-GA-PEI) (left) and illustration depicting the effect of this working parameter on the sensing performance of PEI-GA-PEI-modified NAA interferometers (right).
