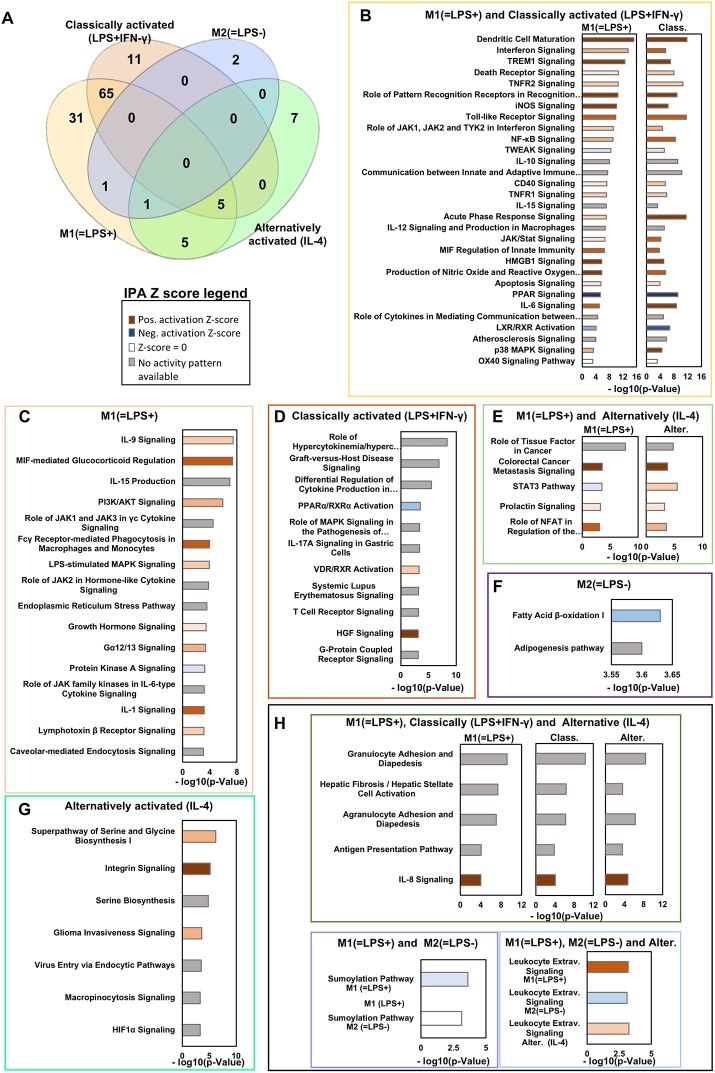
Figure 2.
Ingenuity pathways analysis in vivo M1(=LPS+)C57BL/6J, M2(=LPS–)C57BL/6J, and in vitro classically (LPS+IFN-γ) or alternatively activated (IL-4) macrophages. (A) Venn diagram showing the key canonical pathways enriched in vivo M1(=LPS+)C57BL/6J, M2(=LPS–)C57BL/6J, M2(=LPS–)C57BL/6J, classically activated (LPS+IFN-γ) and alternatively activated (IL-4) macrophage signatures as determined by Ingenuity pathway analysis (IPA). The number of pathways is sorted by a P-value cutoff of 0.001. (B–H) Selected canonical pathways ranked based on –log(P-value) divided as reported in the Venn diagram are shown in the boxes. The Z-score of each pathway is reported by the color of the bars (see legend). Light/Dark shades represent smaller/larger absolute values of Z-score.

