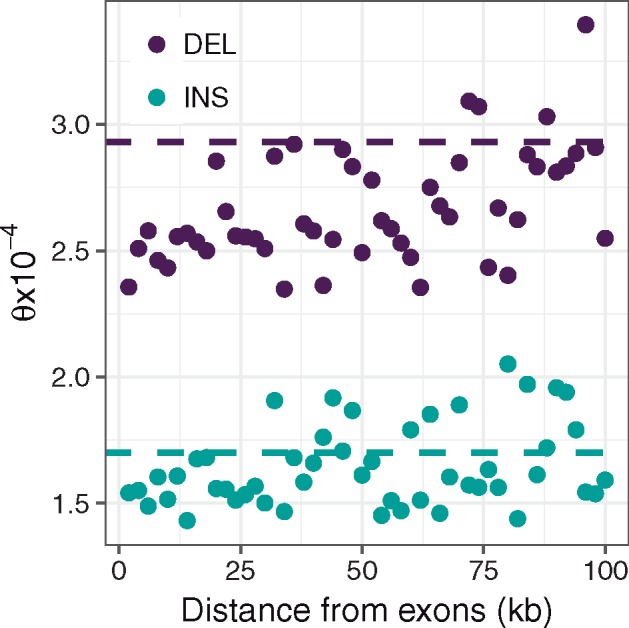
Fig. 3.

—Relationship between mutation rate estimates (θ) for insertions (turquoise) and deletions (purple) and distance from exons in 2-kb windows. Dashed lines represent the genome-wide average mutation rate for noncoding variants, as shown in table 2.
