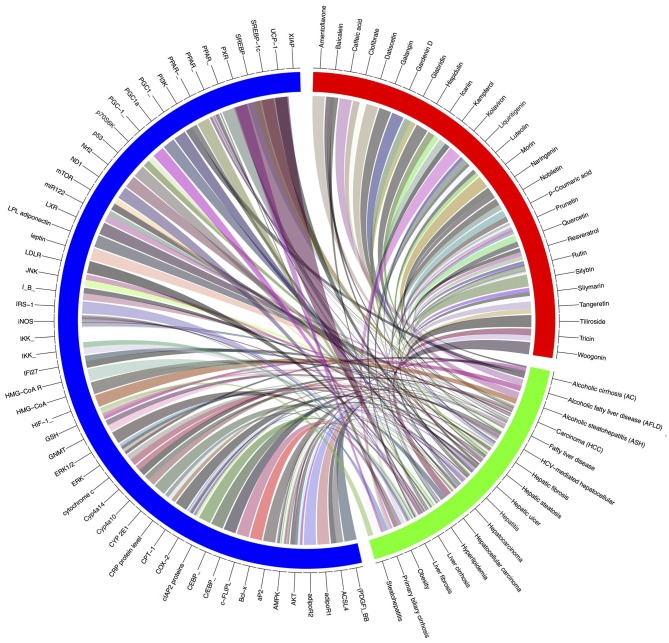
Figure 12.
Gene-modeling showing various hepatic diseases and associated genes with it. A tool named Circus on shiny Circos server generated this image. The blue band is showing various genes responsible for pathophysiological conditions, the green showing various hepatic complications and the red band shows the bioactive natural compounds possessive hepatoprotective activity. Various shades indicating the degree of relatedness between the various bands.

