
Figure 2.
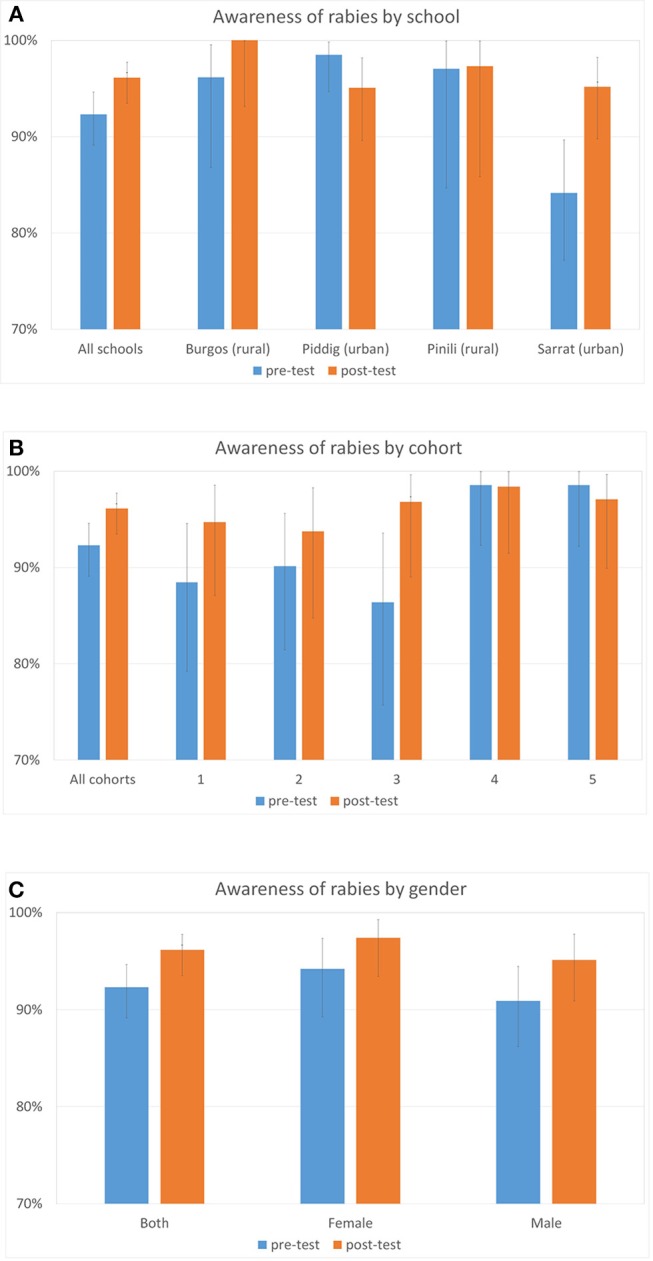
Percentage of students who had heard about rabies in the pre- and post-tests by school (A) by cohort (B) and by gender (C). Error bars are 95% CIs, and asterisks denote significant differences from pre- to post- test.
Official websites use .gov
A
.gov website belongs to an official
government organization in the United States.
Secure .gov websites use HTTPS
A lock (
) or https:// means you've safely
connected to the .gov website. Share sensitive
information only on official, secure websites.
Percentage of students who had heard about rabies in the pre- and post-tests by school (A) by cohort (B) and by gender (C). Error bars are 95% CIs, and asterisks denote significant differences from pre- to post- test.