Figure 4.

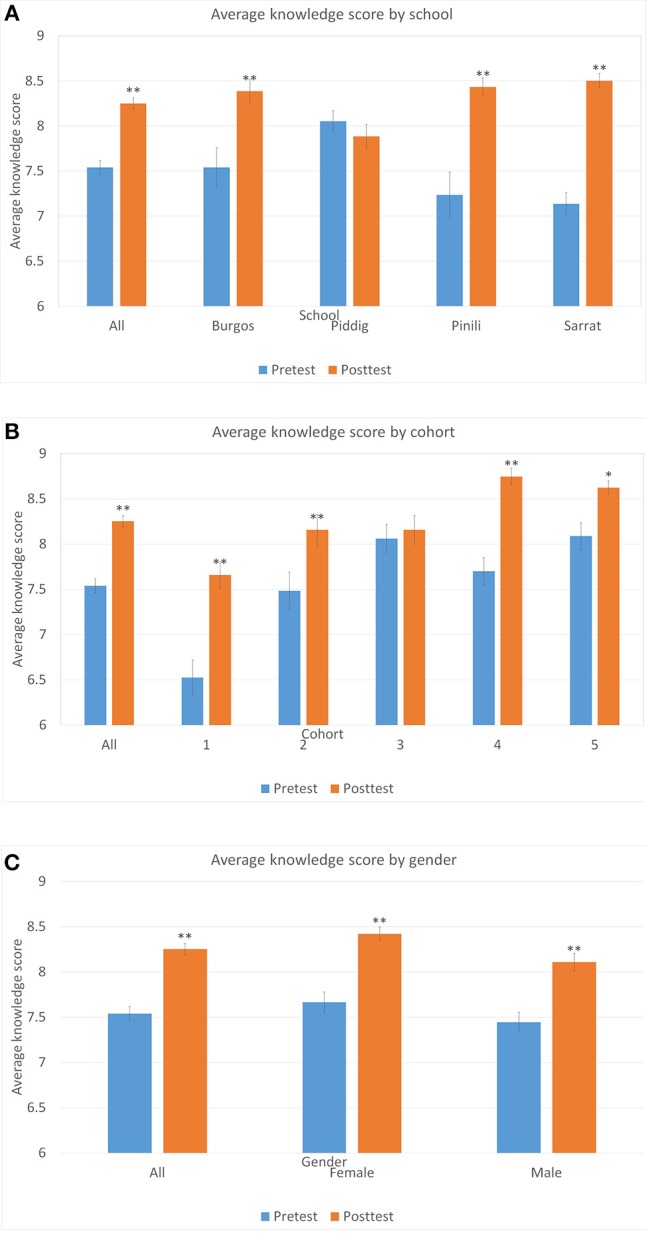
Average knowledge score (maximum score of 9) by school (A), cohort (B), and gender (C). Error bars are standard errors, and asterisks denote significant changes **p < 0.01, *p < 0.05.

Average knowledge score (maximum score of 9) by school (A), cohort (B), and gender (C). Error bars are standard errors, and asterisks denote significant changes **p < 0.01, *p < 0.05.