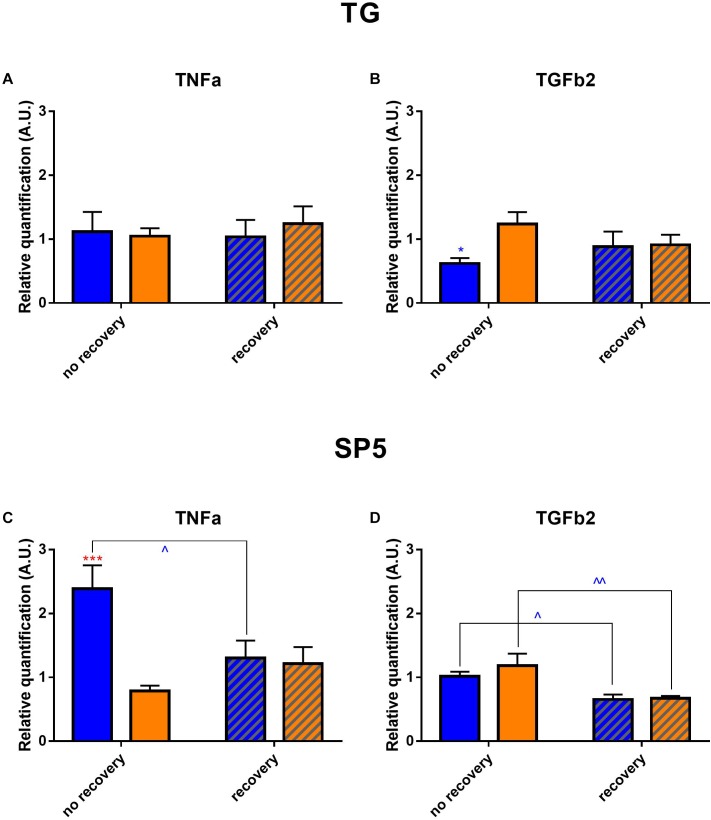
FIGURE 11.
Cytokine profile in trigeminal pathways. Results of mRNA expression of TGFβ2 and TNFα on the TGs (A,B) and brainstems (C,D). Statistical significance for the TG: TGFβ2 blue no recovery vs. recovery – q = 0.0187, p = 0.0178. Statistical significance for the brainstem; TGFβ2: blue no recovery vs. recovery – q = 0.0169, p = 0.0161; yellow no recovery vs. recovery – q = 0.0041, p = 0.0020; TNFα: blue no recovery vs. recovery – q = 0.0197, p = 0.0188; recovery blue vs. yellow – q = 0.0005, p = 0.0005. Blue and yellow bars correspond to blue and yellow exposures, respectively; clear and hatched bars correspond to the time points of dissection, either directly after illumination (no recovery) or in 3 days of recovery (recovery), respectively. All the data are presented as mean ± SEM. Differences were considered significant when p < 0.05 (∗/∧), p < 0.01 (∗∗/∧∧), p < 0.001 (∗∗∗/∧∧∧) or p < 0.0001 (∗∗∗∗/∧∧∧∧). Stars correspond to comparisons between blue-illuminated and yellow-illuminated mice, treated with the same drug. Carets correspond to comparison of mice assessed directly after illumination to the ones assessed after 3 days of recovery, within the same spectra. Red color means increase and blue color decrease in values.

