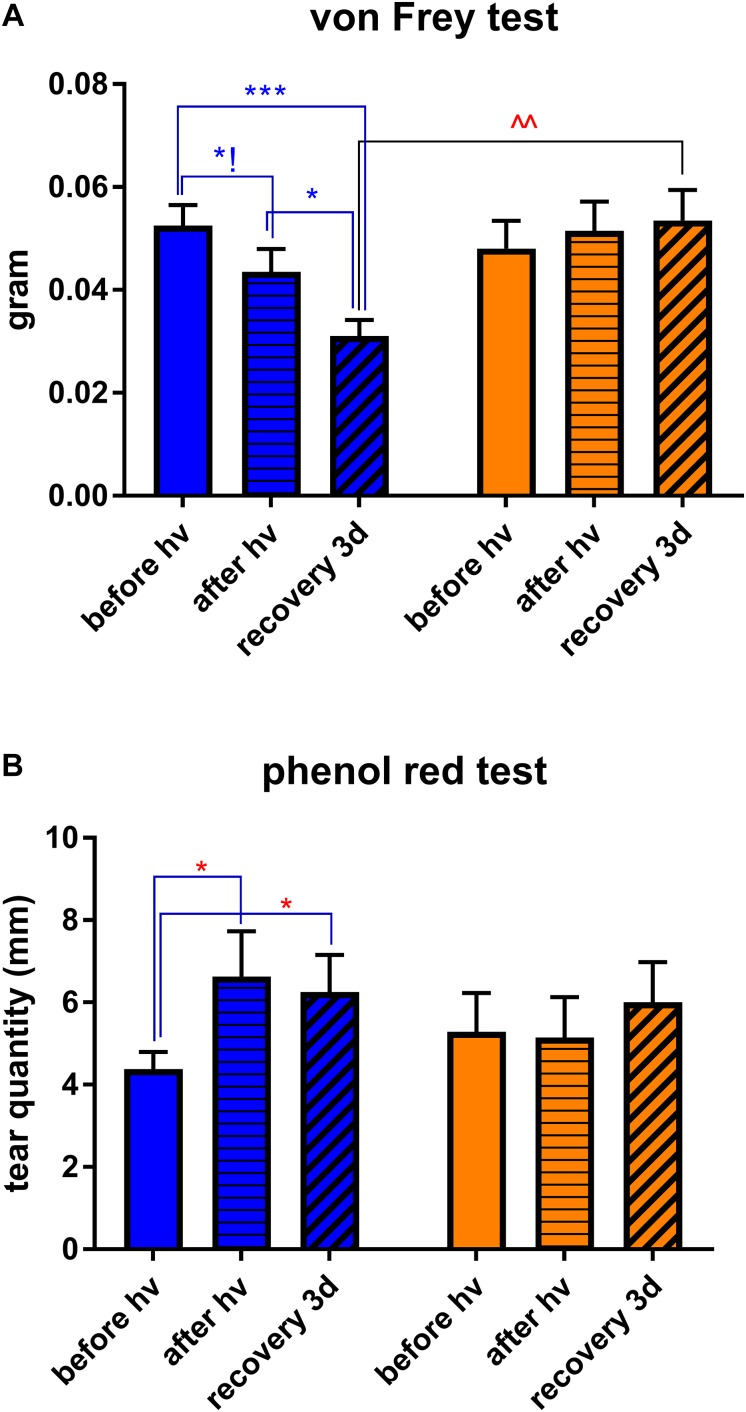
FIGURE 2.
Clinical assessments. Measurements were made at three time points: before hν, before the beginning of illumination; after hν, directly after 3 h of illumination; recovery 3d, after 3 days of recovery in standard illumination conditions of animal unit. (A) Measurement of corneal mechanical sensitivity performed by means of von Frey hair test. Greater values mean lower corneal sensitivity. Statistical significance: blue illumination group: before hν vs. after hν – q = 0.0361, p = 0.1031; before hν vs. recovery 3d – q = 0.0003, p = 0.003; after hν vs. recovery 3d – q = 0.0136, p = 0.0260; recovery 3d group: blue vs. yellow – q = 0.0041, p = 0.0020. (B) Measurement of tear quantity performed by means of phenol red thread test placed into the eye for 30 s. Greater distances mean more important lacrimation. Statistical significance for the blue illumination group: before hν vs. after hν – q = 0.0403, p = 0.0192; before hν vs. recovery 3d – q = 0.0498, p = 0.0475. Blue and yellow bars correspond to blue and yellow exposures, respectively. All the data are presented as mean ± SEM. Differences were considered significant when p < 0.05 (∗/∧), p < 0.01 (∗∗/∧∧), p < 0.001 (∗∗∗/∧∧∧) or p < 0.0001 (∗∗∗∗/∧∧∧∧). Stars correspond to comparisons between values at different time points, within one spectrum. Carets correspond to comparison between blue-illuminated and yellow-illuminated mice, at the same time point. Red color means increase and blue color decrease in values.

